Understanding the Volatility Scanner
The Volatility Scanner is an invaluable tool for traders working with various currency pairs.
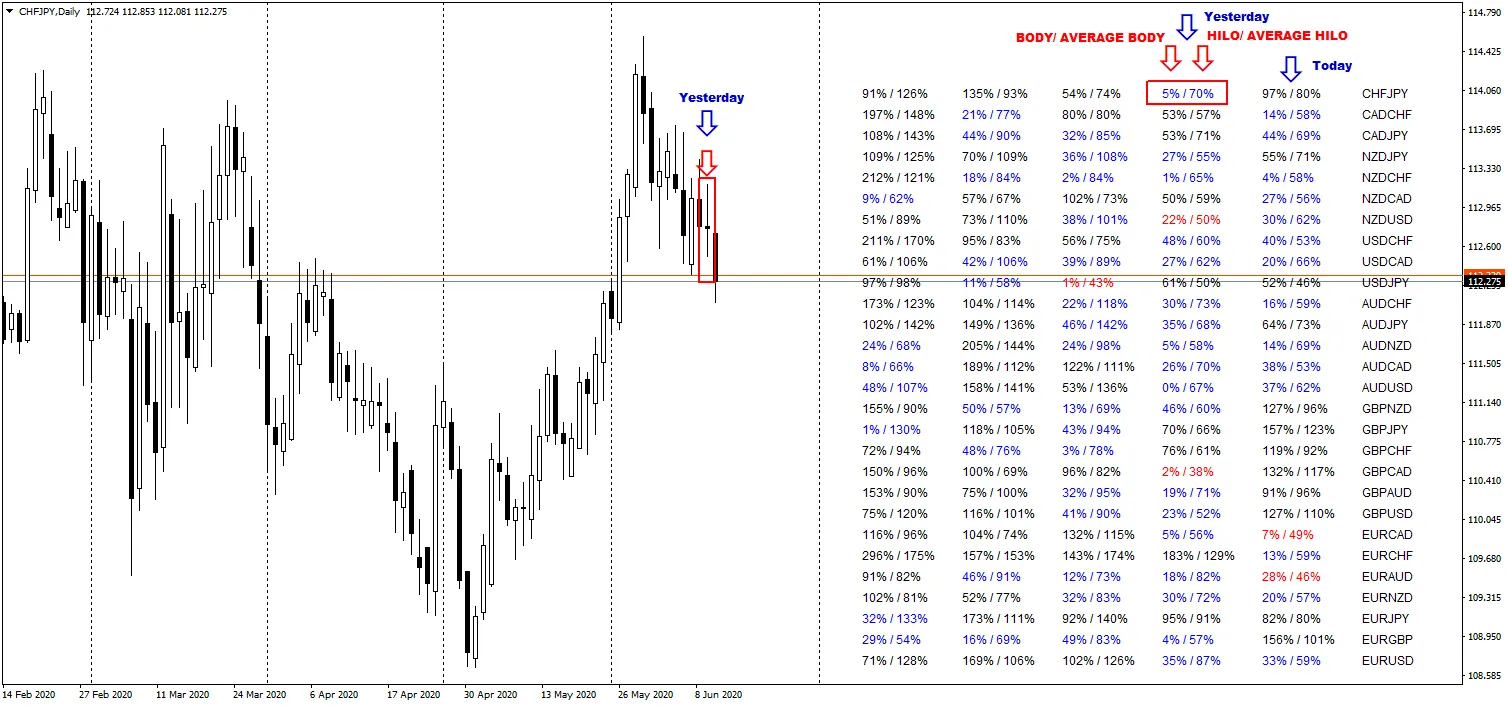
Description:
This indicator provides insights into volatility, displaying data from the current candle (the one on the right side next to the symbol) and extending back through older candles to the left. Each candle has two key metrics:
The left number represents the body size compared to the average body size calculated from the last 100 candles. The right number indicates the high-low size, averaged over the same 100 candles.
To help you quickly identify volatility levels, the indicator uses color coding:
- Blue: The body size is lower than 50% of the average body size, while the high-low size is bigger than 50% of the average high-low size.
- Red: The body size is lower than 50% of the average body size, and the high-low size is lower than 50% of the average high-low size.
You can customize the number of candles displayed and adjust the text size to suit your preferences.
Usage:
This tool is particularly useful for identifying uncertainty or potential swing points, such as a doji bar.


Comments 0