Let’s talk about a rather unusual trading pattern that, believe it or not, actually yields results!
When you spot a downward movement across three consecutive candles on the M15 chart, keep an eye on the Stochastic indicators on the M1 and M5 charts. If you see the green line sitting above the red, that’s your signal!
Now, let’s get down to business regarding Stop Loss and Take Profit settings; these can definitely be fine-tuned to suit your trading style.
Here are the variables you’ll want to keep in mind:
- extern int StopLoss: This one should be straightforward.
- extern int TakeProfit: Same goes for this!
- extern double Lots: If you set this to 0, the lot size adjusts automatically based on your account balance. If it’s set to something else, then you’ve got a fixed lot size.
- extern int MaxOrders: This is the max number of open orders you can have at the same time.
- extern int Periods: Period for the Stochastic used by the EA.
- extern int Periods2: Another period for the Stochastic used by the EA.
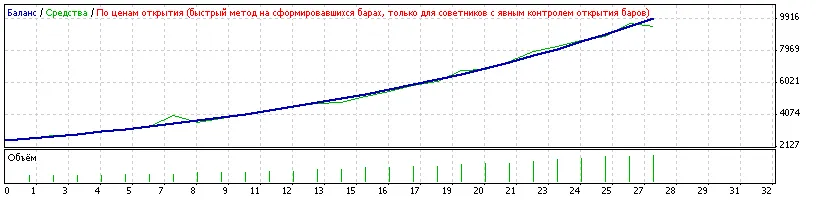
After some tweaking and optimization, the best results surfaced when trading the EUR/JPY pair on the M15 timeframe. The Stochastic periods used were M1 and M5, with a Take Profit set at 145 and Stop Loss at 25. Below are the testing results from a one-month period.
I'm open to any tips you might have! I know this EA isn’t perfect and has its quirks, but I believe there’s potential here.
If you’re interested, I can share modified versions and variations of this strategy!
Thanks for stopping by!
| Symbol | EURJPY (Euro vs Japanese Yen) | ||||
| Period | 15 Minutes (M15) from 2008.11.21 21:30 to 2008.12.31 18:59 | ||||
| Model | Open prices only (fastest method to analyze the most recent completed bar, suitable for EAs that manage bar openings) | ||||
| Parameters | TrailingStop=30; StopLoss=140; TakeProfit=25; Lots=0; magicnumber=777; MaxOrders=1; Periods=1; Periods2=5; | ||||
| Bars in test | 2558 | Ticks modeled | 5013 | Model quality | n/a |
| Mismatched chart errors | 0 | ||||
| Initial deposit | £2,500.00 | ||||
| Net profit | £7,460.93 | Gross profit | £7,460.93 | Gross loss | £0.00 |
| Profit factor | Expected payoff | £276.33 | |||
| Absolute drawdown | £490.14 | Maximum drawdown | £2,676.50 (28.28%) | Relative drawdown | 28.28% (£2,676.50) |
| Total trades | 27 | Short positions (won %) | 0 (0.00%) | Long positions (won %) | 27 (100.00%) |
| Winning trades (% of total) | 27 (100.00%) | Loss trades (% of total) | 0 (0.00%) | ||
| Largest | winning trade | £495.65 | loss trade | £0.00 | |
| Average | winning trade | £276.33 | loss trade | £0.00 | |
| Maximum | consecutive wins (profit in money) | 27 (£7,460.93) | consecutive losses (loss in money) | 0 (£0.00) | |
| Maximal | consecutive profit (count of wins) | £7,460.93 (27) | consecutive loss (count) | 0 (£0.00) | |
| Average | consecutive wins | 27 | consecutive losses | 0 | |


Comments 0