Introduction:
Tick charts are an invaluable tool for traders looking to get a deeper insight into market movements. By utilizing this indicator in MetaTrader 4, you can create offline tick charts that offer a detailed view of price action for your selected symbols.
How to Set Up Tick Charts:
To get started, you'll need to tweak a few lines of code. Here’s how:
You'll need to uncomment the following lines in your code:
// Please uncomment the include file//#include <WinUser32.mqh>
Or, if you're downloading the file, make sure to uncomment these lines as well:
// Please uncomment the below lines after downloading the file//if(hwnd!=0)// && cur_time-last_time>=2)// {// PostMessageA(hwnd,WM_COMMAND,33324,0);// last_time=cur_time;// }
Due to CodeBase policies, I can’t upload the file without these modifications. So, ensure you uncomment the following lines:
// Please uncomment the include file#include <WinUser32.mqh>

// Please uncomment the below lines after downloading the fileif(hwnd!=0)// && cur_time-last_time>=2)
  {
   PostMessageA(hwnd,WM_COMMAND,33324,0);
   last_time=cur_time;
  }
Once you’ve done this, your code should work seamlessly.
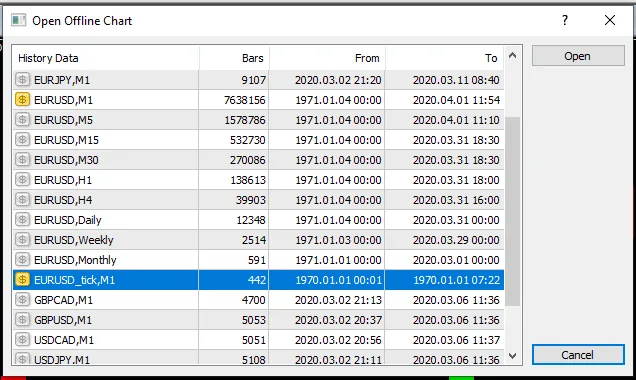
Visual Guide:
Check out where to find the symbol to open your chart:
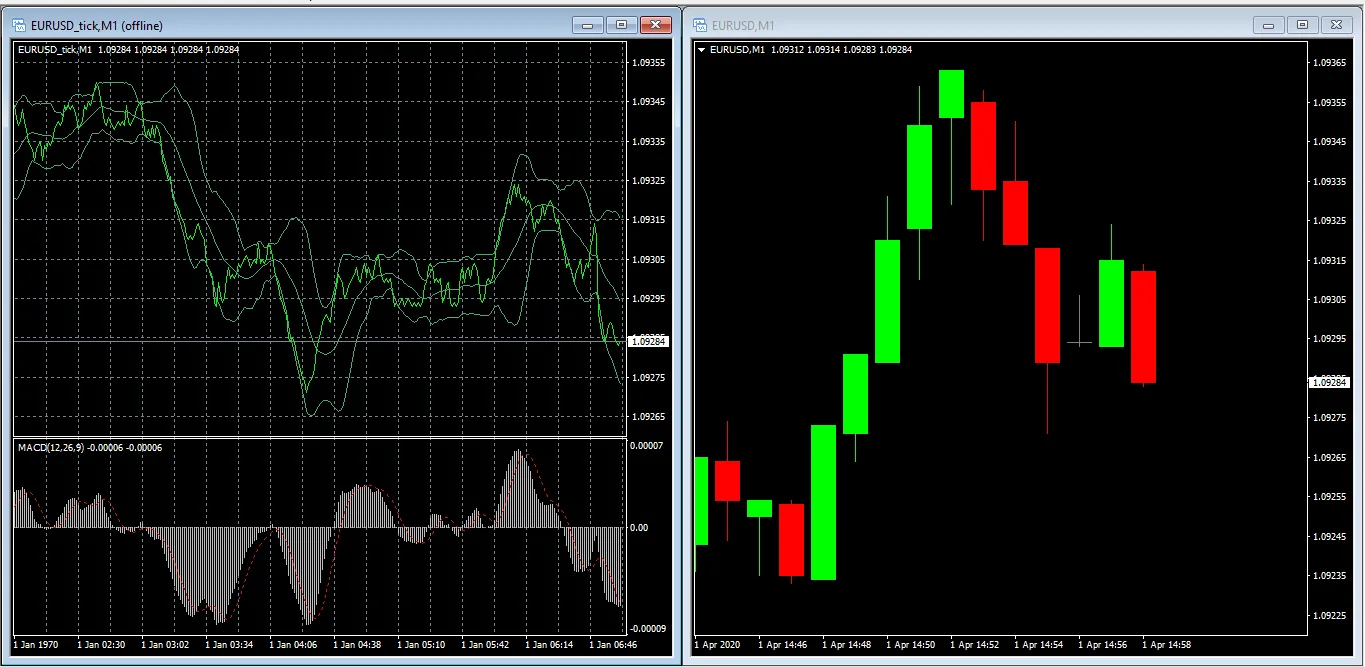
Here’s how it looks in action:
Conclusion:
By creating tick charts, you can enhance your trading analysis significantly. These charts provide essential insights into price movements, helping you make better-informed trading decisions.


Comments 0