Bollinger Squeeze Advanced Indicator for MetaTrader 5 is a powerful tool designed to help traders identify market trends and volatility.
- This indicator combines two main components:
- A measure of trendiness based on the Bollinger Bands and the Keltner Channel "squeeze".
- A histogram that indicates trend direction and strength, utilizing one of eight oscillators: Stochastic, CCI, RSI, MACD, Momentum, Williams % Range, ADX, or DeMarker.
The histogram is displayed in a separate window on your chart, with bar colors and widths providing additional insights. It supports multi-timeframe (MTF) functionality and includes various alert options. This indicator is compatible with both MT4 and MT5 versions of the trading platform.
Bollinger Squeeze Advanced is part of the Not So Squeezy indicator system, enhancing your trading toolkit.
Input Parameters
- Timeframe (default = Current) — Choose the timeframe for data display. This indicator can show higher timeframe data even on a lower timeframe chart.
- TriggerType (default = DeMarker) — Select the oscillator for the trend measurement histogram.
- StochasticPeriod (default = 14) — Set the period for the Stochastic indicator (if selected via TriggerType).
- CCIPeriod (default = 50) — Set the period for the CCI indicator (if selected via TriggerType).
- RSIPeriod (default = 14) — Set the period for the RSI indicator (if selected via TriggerType).
- MACDFastEMAPeriod (default = 12) — Define the fast EMA period for the MACD indicator (if selected via TriggerType).
- MACDSlowEMAPeriod (default = 26) — Define the slow EMA period for the MACD indicator (if selected via TriggerType).
- MACDMACDEMAPeriod (default = 9) — Set the signal line period for the MACD indicator (if selected via TriggerType).
- MomentumPeriod (default = 14) — Set the period for the Momentum indicator (if selected via TriggerType).
- WilliamsPRPeriod (default = 24) — Set the period for the Williams % Range indicator (if selected via TriggerType).
- ADXPeriod (default = 14) — Set the period for the ADX indicator (if selected via TriggerType).
- DeMarkerPeriod (default = 13) — Set the period for the DeMarker indicator (if selected via TriggerType).
- AlertOnSidewaysTrending (default = false) — If true, the indicator will send alerts when the market shifts from Trending to Sideways and vice versa.
- AlertOnZeroCross (default = false) — If true, alerts will be triggered when the histogram crosses the zero line or defined levels.
- AlertAboveLevel (default = 0) — Set an alert level when the indicator's value rises above this threshold.
- AlertBelowLevel (default = 0) — Set an alert level when the indicator's value falls below this threshold.
- EnableNativeAlerts (default = false) — If true, the indicator will utilize MetaTrader's native pop-up alerts.
- EnableEmailAlerts (default = false) — If true, the indicator can send email alerts. Ensure that your MetaTrader is configured correctly via Tools -> Options -> Email.
- EnablePushAlerts (default = false) — If true, the indicator will send push notifications. Configure these settings in MetaTrader via Tools -> Options -> Notifications.
- TriggerCandle (default = Previous) — Choose the candle for alerts: Previous for the last closed candle or Current for the ongoing candle.
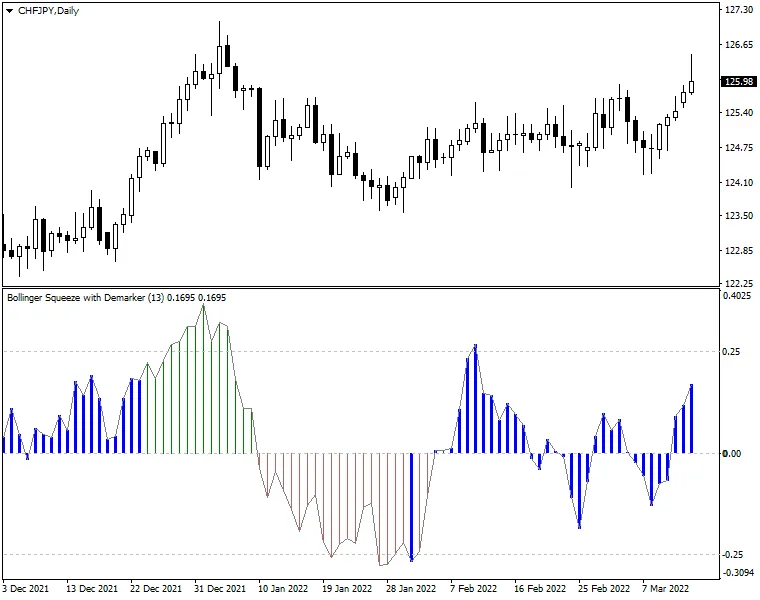
This indicator leverages one of the eight oscillators to gauge the strength and direction of trends, presenting it as a histogram:
- Green bars above the zero line indicate upward trends.
- Red bars below the zero line signify downward trends.
Moreover, the Bollinger Squeeze Advanced includes a built-in measure of volatility. When the Bollinger Squeeze suggests a sideways market (Bollinger Bands are within the Keltner Channel), the histogram bars turn into thick blue bars.
The core idea behind this indicator is to identify trading ranges during non-trending market phases (indicated by blue histogram bars) to capture breakouts when the bars switch back to normal. The histogram not only helps you assess the current trend's strength but also signals when it's time to exit a trade as the trend shows signs of weakening.


Comments 0