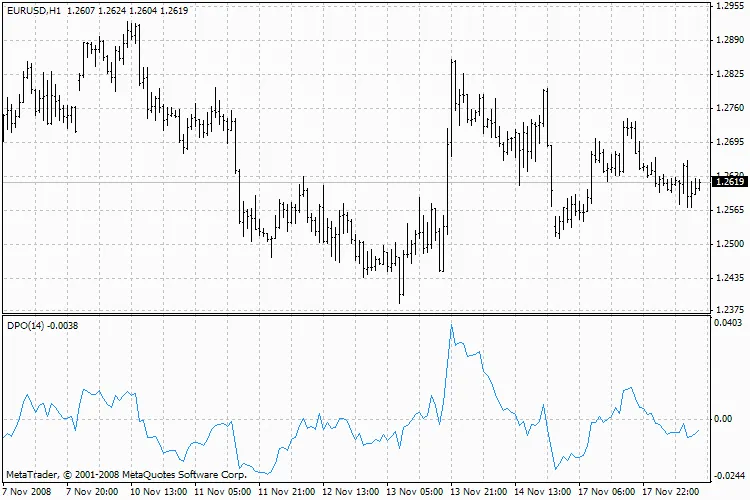
Hey fellow traders! Today, let's dive into a fascinating technical indicator known as the Detrended Price Oscillator (DPO). If you’ve been around the trading scene, you might have noticed that the DPO resembles a moving average. This is because it filters out the trend direction in price values, making it easier to spot market cycles.
The DPO works by plotting a moving average as a straight horizontal line. Then, it places the price values along this line based on their relation to the moving average. This helps you quickly identify whether the market is overbought or oversold, giving you a clearer picture of potential price reversals.
Curious about how it’s calculated? Here’s the formula you’ll need:
DPO(i) = Close(i) - SMA(i, N)
Where N represents the period of the moving average. This simple calculation is what helps you gauge the price action without the noise of trends.
Incorporating the DPO into your trading strategy can provide valuable insights, especially when combined with other indicators. So, give it a shot and see how it enhances your trading game!


Comments 0