The Fast Stochastic is a popular technical indicator developed by George C. Lane that many traders use to gauge market momentum.
This indicator measures the relative position of the current closing price against the highest high and the lowest low over a specified time period. Essentially, it calculates how fast the price is moving, giving traders insight into potential price changes.
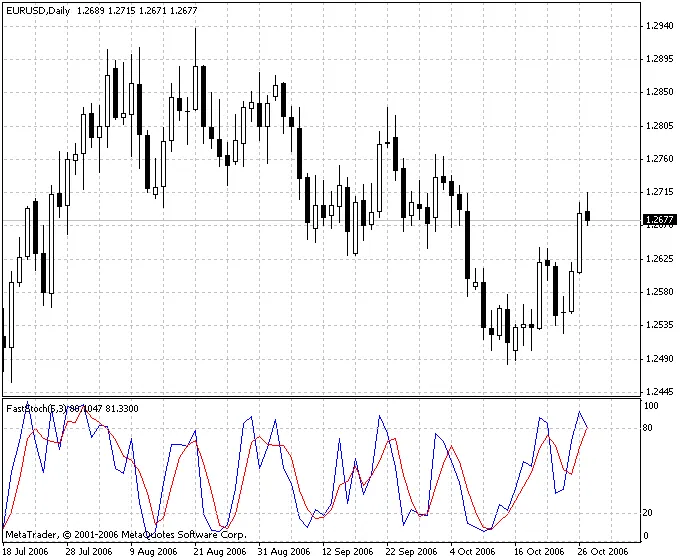
On your charts, you'll see the Fast Stochastic represented by two lines: %K and %D. Here’s a quick breakdown of how the Fast Stochastic is calculated:
- %K(i) = 100 * (Close(i) - MaxHigh(N)) / (MaxHigh(N) - MinLow(N));
- %D(i) = MA(%K(i), P);
Where:
- Close(i) = the closing price of the current bar;
- MaxHigh(N) = the highest price over the last N periods;
- MinLow(N) = the lowest price over the last N periods;
- MA = moving average;
- N = the number of periods for high/low calculation;
- P = the smoothing period for %D(i).
This calculation helps traders identify overbought or oversold conditions in the market, making it a handy tool for entry and exit points.


Comments 0