Understanding RSI and Moving Averages
If you're diving into the world of trading, you've probably heard of the Relative Strength Index (RSI) and Moving Averages. These powerful indicators can help you make informed decisions and improve your trading strategy.
What is RSI?
The RSI is a momentum oscillator that measures the speed and change of price movements. It's typically used to identify overbought or oversold conditions in a market. When the RSI crosses above 70, it indicates that the asset might be overbought, while a reading below 30 signals that it could be oversold.
How to Use Moving Averages
Moving Averages smooth out price data to identify trends over a specific period. The two most common types are the Simple Moving Average (SMA) and the Exponential Moving Average (EMA). Traders often use these averages to spot potential reversal points and confirm trends.
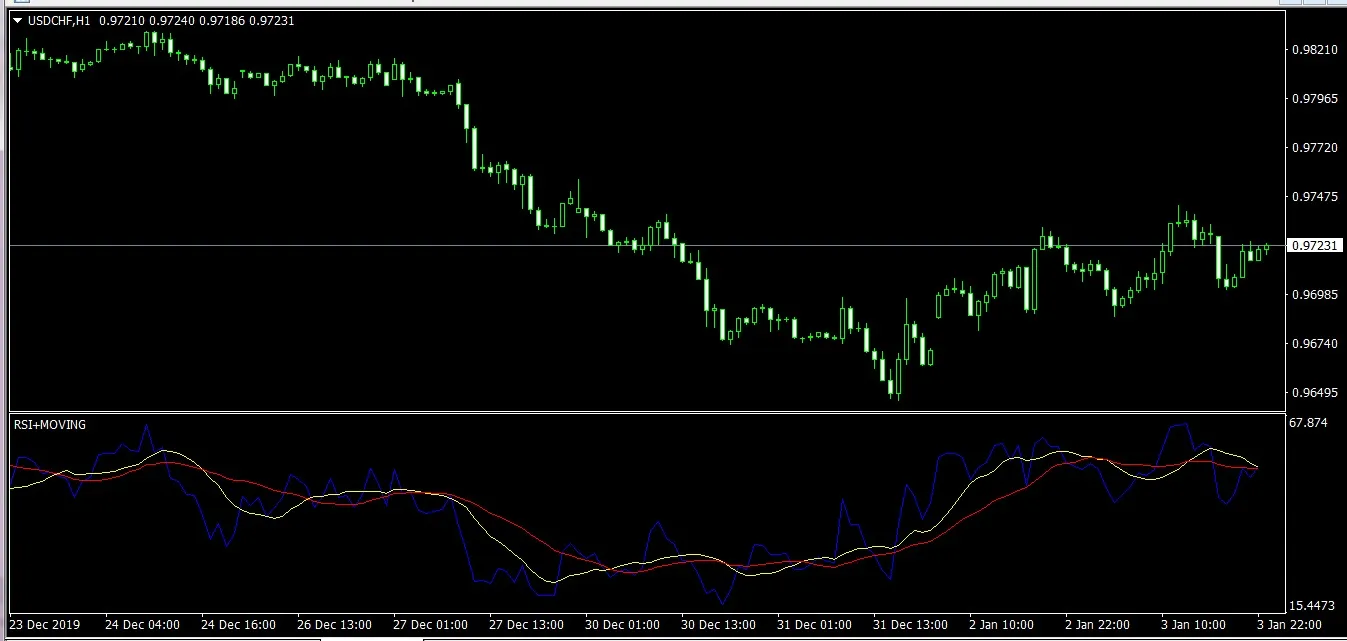
Combining RSI and Moving Averages
When you combine RSI with Moving Averages, you can create a robust trading strategy. For instance, you might look for RSI signals in conjunction with price crossing above or below a Moving Average. This dual confirmation can enhance your chances of a successful trade.
Tips for Using RSI and Moving Averages
- Set Your Timeframes: Adjust the RSI and Moving Average settings according to your trading style, whether you're a day trader or swing trader.
- Look for Divergences: Pay attention to divergences between price and RSI, as these can signal potential reversals.
- Practice with a Demo Account: Before committing real money, practice using these indicators on a demo account to refine your strategy.
By mastering RSI and Moving Averages, you’ll be well on your way to making smarter trading decisions. Happy trading!


Comments 0