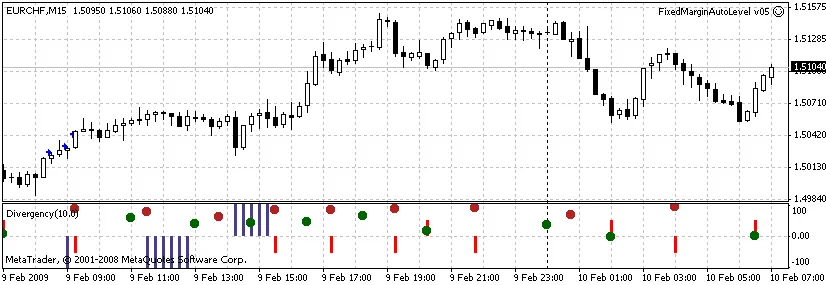
Divergence can be a powerful tool in your trading arsenal. When you see the blue bar pointing upwards, it’s a good sign that the price is likely to rise. On the flip side, if it points downwards, expect the price to drop.
Keep an eye on the dots—they mark the peaks (or fractals) identified by the indicator you’re using.
Watch out for those red bars! They indicate the highest peaks, which can be a weak signal suggesting the price might 'roll back' and move slightly against the prevailing trend.
To get started with divergence, you can use these two indicators:
- i-Divergency.mq4 - This version is based on stochastic calculations.
- i-DivMACD.mq4 - This one uses the MACD for divergence analysis.
If you're looking to analyze different indicators, you can easily swap out the line in your code:
Stochastic[CurBuffer]=iStochastic(NULL,0,5,3,3,MODE_EMA,0,MODE_MAIN,CurrentCandle);
Just replace it with the indicator you want to analyze.
Just a heads up: false signals can happen, so don't let them catch you off guard!


Comments 0