If you're looking to enhance your trading strategy, the Higher Timeframe Indicator for MetaTrader 4 is a game changer. This nifty tool allows you to see higher timeframe candles on your current chart, giving you valuable insights into market trends.
For example, check out the screenshot below, which displays the D1 (daily) candle on an H1 (hourly) timeframe. This can help you make more informed decisions by allowing you to spot trends that you might miss if you're only looking at shorter timeframes.
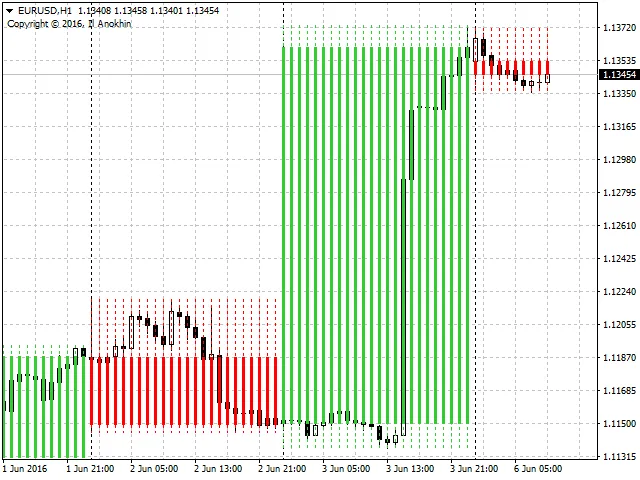
Using the Higher Timeframe Indicator is straightforward. It overlays the daily candle onto your hourly chart, enabling you to gauge the bigger picture without switching back and forth between timeframes.
Why Use Higher Timeframe Analysis?
- Identify Major Trends: Seeing the daily candle helps you understand the overall market direction.
- Make Better Entry and Exit Decisions: Align your trades with the broader trend for increased success.
- Avoid Noise: Shorter timeframes can be choppy; this indicator helps filter out the 'noise'.
So, if you want to level up your trading game, give the Higher Timeframe Indicator a try on your MetaTrader 4 platform. It’s a simple yet powerful addition to your trading toolkit!


Comments 0