Author:
Are you looking to enhance your trading experience? The GraphOnGraph indicator is perfect for displaying the charts of two currency pairs right in a single window, making your analysis more efficient.
Input Parameters:
- symbol - This is the currency pair you want to overlay on the main chart of another currency pair.
- timeFrame - Specify the time frame of the currency pair you wish to add to the main chart.
- price - Choose the price type for drawing the chart of the added currency pair. You can select from: Open, Close, Median.
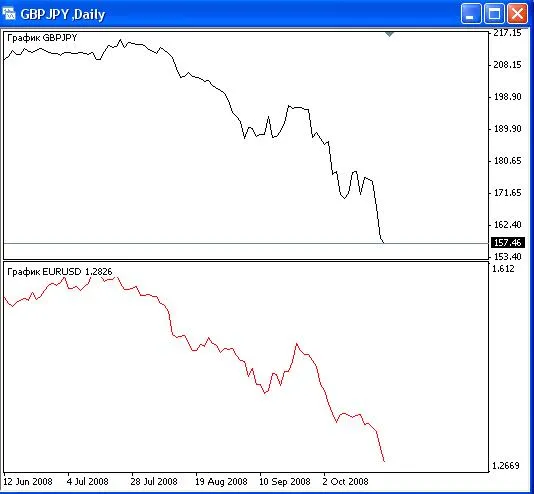
Visual Example:
A Note on Enhancements:
If you're like me and wanted to add more features, I had a bit of a hiccup trying to draw the chart of the added currency pair using bars and candlesticks. While drawing with a line is straightforward:
SetIndexStyle(0,DRAW_LINE);
But how do you go about implementing bars or candlesticks? If you have any tips, I’d love to hear them!


Comments 0