The Chande Kroll Stop indicator is a handy tool for setting your stop loss levels in trading. It charts two lines on your price graph that help signal when it might be time to close your positions.
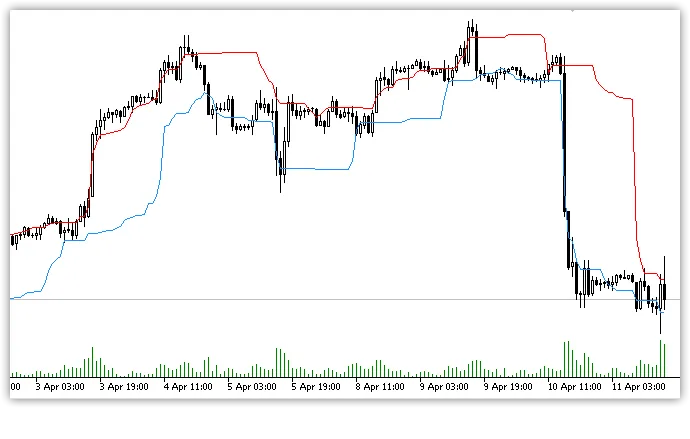
- Long Position Line (Green): This line indicates where you should set your stop loss for long positions. If the asset's price begins to drop and hits this line, it’s often a good signal to close your buy orders.
- Short Position Line (Red): Conversely, this line marks the point for closing short positions. If the price starts to rise and touches this line, it could be a cue to exit your sell orders.
The Chande Kroll Stop is calculated using the true range, making it a versatile indicator that works well regardless of market volatility. It was popularized in Tushar Chande and Stanley Kroll's book, "The New Technical Trader." Designed for trend-following strategies, this indicator helps traders identify stop levels by measuring the average true range of market trends while factoring in volatility.
This indicator operates by analyzing the maximum and minimum price values over a specified period and incorporating the standard deviation (ATR). This way, it adapts to the current market conditions, helping you stay in tune with the price action.
Market volatility plays a crucial role in how the Chande Kroll Stop functions. When volatility is high, the stop lines are positioned further away from the current price, giving traders more breathing room for fluctuations. On the flip side, during low volatility periods, these lines come closer to the price, enabling traders to react swiftly to any market changes.


Comments 0