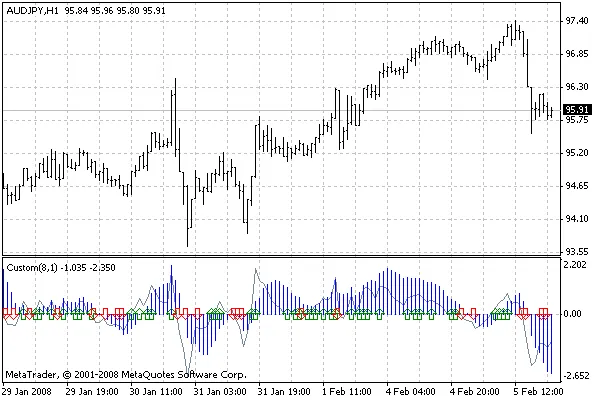
Understanding the Combined MA Signal Indicator
If you're trading on higher timeframes like H4, D1, or W1, set Slow to false (0). For shorter timeframes such as H1, M30, M15, or M5, make sure to set Slow to true (1). This will allow arrows to appear on your charts, indicating potential entry points.
When you set the Signal parameter to 3 (though 8 is ideal), the indicator calculates the Moving Average using the formula: 1x2 + 2x2 + 3x2 (minus) 1x3 - 2x3 - 3x3. This approach provides a more comprehensive signal compared to using separate averages.
while (count > 0)
{
    dif = iMA(NULL, 0, (count * 2), 0, 3, 0, i) -
          iMA(NULL, 0, (count * 3), 0, 3, 4, i) +
          iMA(NULL, 0, (count * 2), 0, 3, 4, i) -
          iMA(NULL, 0, (count * 3), 0, 3, 1, i);
    if (count >= Signal / 2) ExtGreenBuffer[i] += dif;
    if (dif != 0.0) dif /= (count + 1) / 2;
    if (count + 1 <= Signal) ExtSilverBuffer[i] += dif;
    count--;
}
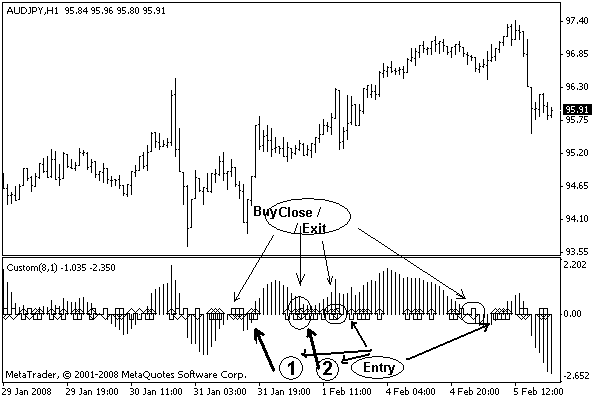
When integrating this indicator into your trading systems, use Buffer 2 [Method 2] for Buy signals (if > 0.0) and Buffer 3 [Method 3] for Sell signals (if < 0.0).
Entry and Exit Strategies
For entry points, a combination of D1, H4, and H1 signals is recommended. It's crucial that these signals align but do not all occur on the same bar for a stronger confirmation.
As for exits, watch for changes on the H1 or H4 charts. A shift here can indicate it's time to close your position.
The optimization parameters for this indicator can be leveraged during your trading strategy development. However, keep in mind not to set optimizations for longer than a day, as this could lead to lengthy freezing times when set to 5, 10, 15, or more minutes. Be sure to read the accompanying file for detailed instructions.
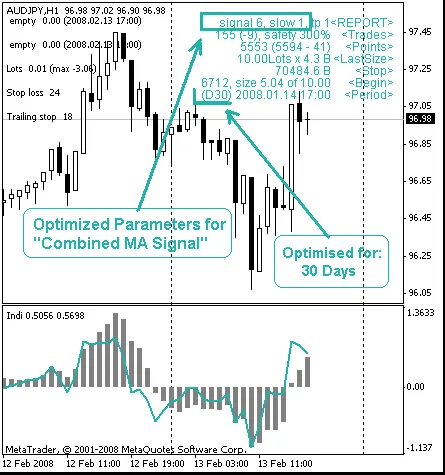
Once your optimization is complete and you've gathered your results, you can safely remove the optimizer from your chart. Happy trading!


Comments 0