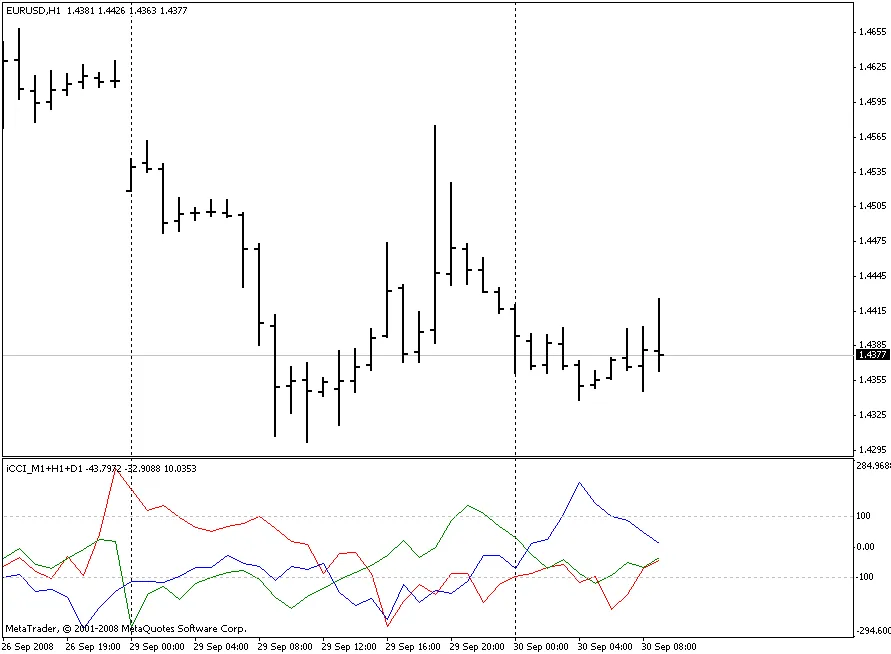
The iCCI indicator is a fantastic tool for traders, built on the classic CCI framework. It showcases three distinct lines, each representing a different time frame, all in one handy subwindow.
Red Line - M1 Period
Green Line - H1 Period
Blue Line - D1 Period
This indicator is particularly useful for spotting trends and potential reversals across different time frames, helping you make informed decisions in your trading strategy. Whether you're a scalper or a swing trader, integrating the iCCI into your toolkit can enhance your analysis and improve your trading outcomes!


Comments 0