Description:
If you're looking to refine your trading game, the Rj_HSlice 1.1 indicator for MetaTrader 4 is a tool you won't want to overlook. This handy indicator displays the buy and sell ranges, giving you a clearer picture of market dynamics.
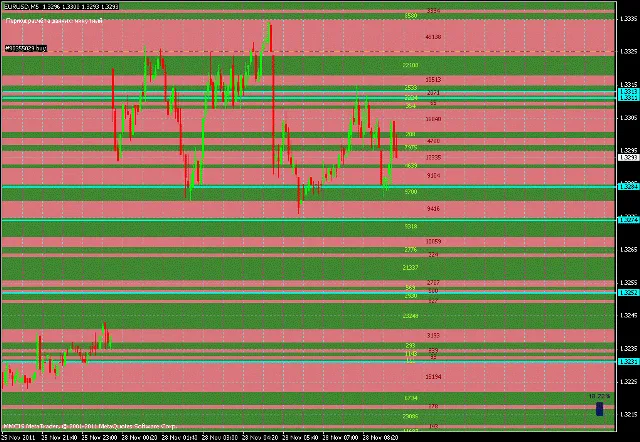
The green zone highlights price levels where buying activity has been strong over a certain period, indicating a surplus of contracts. Conversely, the red zone signifies where selling is more prevalent. Think of it as a bridge between Call/Put dynamics and Support/Resistance levels.
Rj_HSlice 1.1 works in tandem with the Rj_Volume indicator, which calculates volume on a minute-by-minute basis and feeds that data directly to Rj_HSlice. Remember, Rj_Volume isn’t meant to be attached to your chart, so keep it in the background.
To install, simply drop the two files into the Terminal under experts > indicators, compile the editor, and attach Rj_HSlice to your chart. It’s as easy as that!
One thing to keep in mind is that the values on the 5-digit terminal might show discrepancies, but don't let that throw you off.
Rj_HSlice 1.1 has a tweaked HF calculation that not only considers minute blunders but also incorporates other Time Frames (TFs). The default setting is CalcPeriod = 1, which means all calculations are done in minutes. If you need to adjust for a different timeframe, just input 60 for hourly data. The system is smart enough to prevent configuration errors; even if you set it to 50, it will still look for the nearest higher timeframe.
You'll find commentary in the upper left corner indicating which timeframe is being calculated. Here are some customizable features:
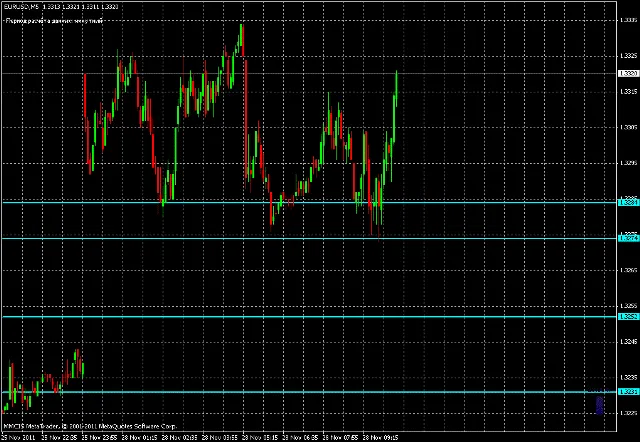
- ShowLevelsOn = true: Displays all price levels; set to false to hide them.
- ShowContractOn = true: Displays contract values; again, set to false to remove these.
- BackgroundLevelOn = true: This will show a background rendering when levels are displayed.
- ShowTurningOn = true: This option sets a support/resistance line at levels where contract values are similar.
- PercentDiscrep = 0.2: Sets the rate of difference between levels, with 20% being the default.
The lines adjust dynamically, allowing you to keep track of price behavior, which can lead to insightful trading decisions.
As for aesthetics, you can customize the color of the lines with ColorLine = Aqua.
Check out these visuals for a better understanding:
And here's what it looks like with ShowLevelsOn = false:
For those curious about the mechanics, here's the lowdown:
- If the candle Open [] , then:
- buy = (High [] - Low []) + (Close [] - Open [])
- sell = High [] - Low []
- dist = Volume [] / (buy + sell): This gives you the volume of distribution per point, leading to:
- Call = dist * buy / sell
- Put = dist
- The opposite applies for bearish candles.
If you encounter a blue screen or notice nothing displaying, you might need to upload your history or save it as a template for a fresh start.
So go ahead, give Rj_HSlice 1.1 a spin, and feel free to reach out with any questions. Let’s make those profits together!


Comments 0