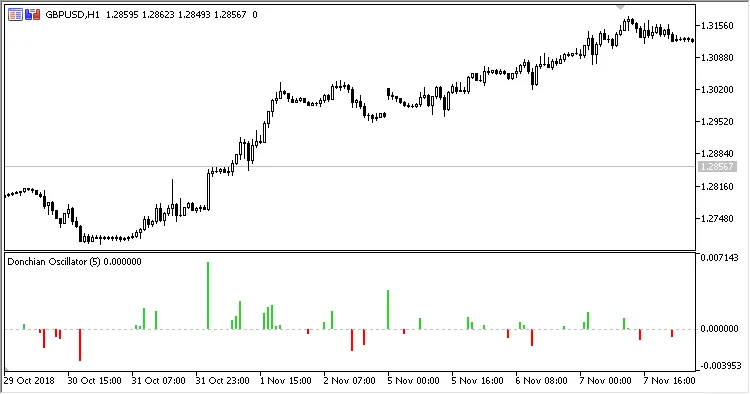
The Donchian Oscillator is a fantastic tool for traders looking to gauge market momentum. Essentially, it measures the ratio between the current price and the Donchian channel. Here’s how it works: when the current Close price is above the Donchian channel, the oscillator generates a positive histogram bar. This bar reflects how far above the upper channel border the price is. Conversely, if the Close price dips below the channel, it draws a negative histogram bar, indicating the distance from the price to the lower channel border.
To customize the Donchian Oscillator, you’ll need to adjust one key parameter:
- Period - This defines the calculation period for the Donchian channel.
Calculation:
- If Close > Max
Green histogram bar = Close - Max - If Close Red histogram bar = Close - Min
Where:
Max, Min - These refer to the highest High and the lowest Low within the specified Period range.


Comments 0