The Momentum Technical Indicator is a popular tool that traders use to gauge the price changes of financial instruments over a specific period. It helps in identifying potential trading opportunities based on price momentum.
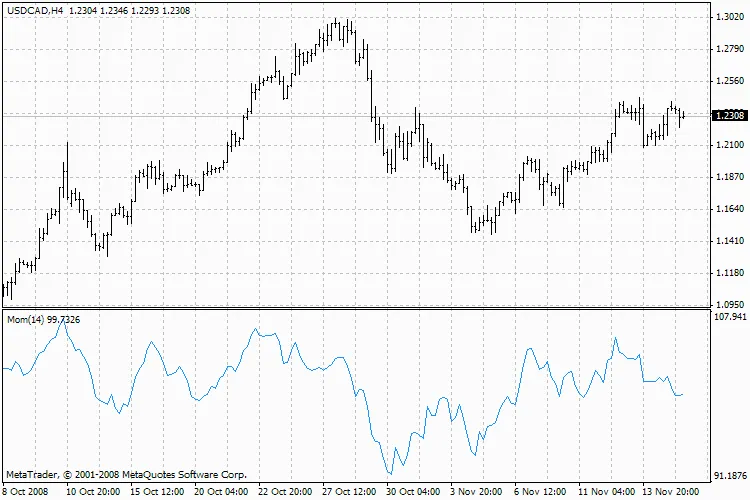
Momentum Indicator
There are two primary ways to leverage the Momentum indicator:
Trend-Following Approach: You can use the Momentum indicator much like the MACD indicator. A buy signal is generated when the Momentum indicator forms a trough and begins to rise, while a sell signal is indicated when it peaks and starts to decline. It’s often helpful to overlay a short-term moving average on the indicator to better identify when it’s bottoming out or peaking. Extreme high or low readings suggest that the current trend will continue. So, if the Momentum indicator hits a peak and then starts dropping, expect price growth to follow. Always wait for price confirmation before entering or exiting trades based on the indicator's signals.
Leading Indicator Approach: This method operates on the assumption that rapid price increases typically accompany the final leg of an uptrend (when everyone is bullish), while sharp declines signify the end of a bear market (when traders want to exit). As the market nears its peak, the Momentum indicator generally experiences a sharp rise, followed by a decline even as prices continue to rise or stabilize. Conversely, at market bottoms, Momentum tends to fall sharply before it turns upward, often well ahead of price increases. Both scenarios create divergences between the indicator and price action.
Momentum Calculation
Momentum is calculated as follows:
MOMENTUM = CLOSE (i) / CLOSE (i - n) * 100
Where:
CLOSE (i) — the closing price of the current bar;
CLOSE (i - n) — the closing price n bars ago.
Indicator Description
For a complete breakdown of the Momentum indicator, check out the Technical analysis: Momentum section.


Comments 0