Hey traders! Today, let's dive into the Parabolic SAR indicator, specifically the PSAR_2B_Line, which is a handy tool for your trading arsenal on MetaTrader 4.
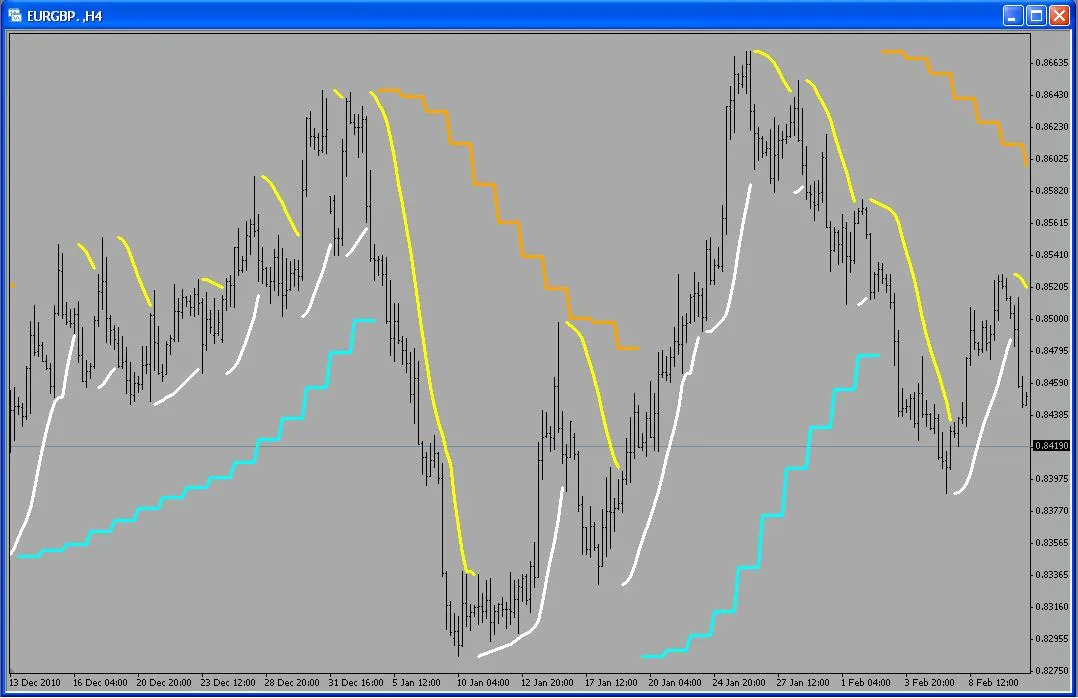
In this indicator, we get a clear view of the current time frame with the White Line and Yellow Line, while the next available time frame is represented by the Aqua Line and Orange Line.
Check out the visual below to see how it all comes together:
Understanding how these lines interact can help you make informed decisions in your trading strategies. So, whether you’re a seasoned trader or just starting out, this indicator can provide valuable insights into market trends.


Comments 0