Hey there, fellow traders!
As the holiday season rolls in, I'm excited to share something truly special with all of you!
Introducing the SuperMultiChart, a powerful tool designed for MetaTrader 4 that can transform your trading experience!
What Makes SuperMultiChart So Versatile?
- Unlimited Currency Selection: Choose as many currencies as you like, organized in a way that suits your trading style.
- Display Range Settings: Adjust the width of each currency chart to your preference.
- Individual Period Settings: Set the time frame for each currency chart separately.
- Visual Positioning: Easily manage the overall position of your multi-chart within the window.
- Customizable Information: Add extra details in the program code for display as needed.
How to Use It Effectively?
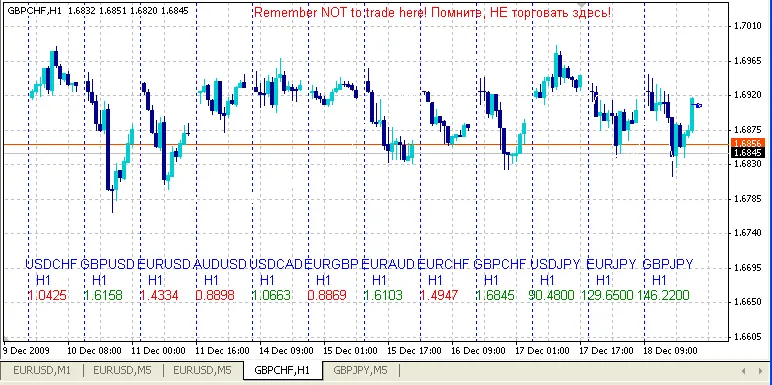
The SuperMultiChart is perfect for analyzing multiple currencies or even tracking a single currency across various time frames. It's great for spotting correlations and identifying group movements in the market.
Check out the example below to see these factors in action:
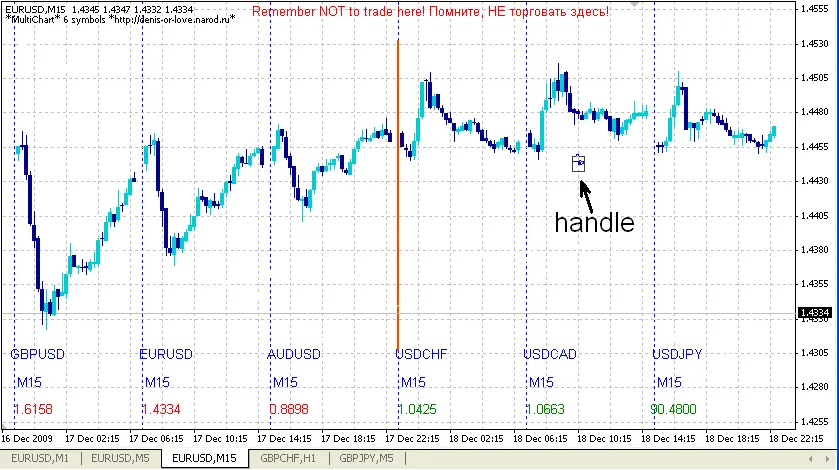
In this image, you can see a handy "handle" that allows you to move the multi-chart up or down within the window. You can refresh the chart manually or it will update automatically when new ticks arrive.
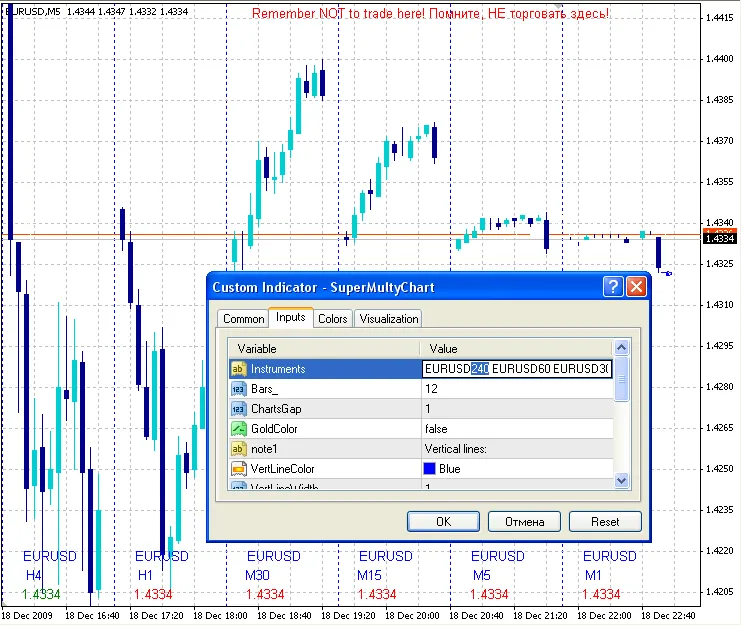
Chart Settings:
Setting of the charts:
Instruments = "EURUSD240 EURUSD60 EURUSD30 EURUSD15 EURUSD5 EURUSD1";
Bars_ = 12; // Number of bars in the chart
ChartsGap = 1; // Spaces between the charts
GoldColor = False; // Toggle gold color scheme for dark backgrounds
Setting of lines:
VertLineColor = Blue; // Color of vertical lines
VertLineWidth = 1; // Width of vertical lines
VertLineStyle = 2; // Style of vertical lines
Setting of text:
TextY = 60; // Space from the bottom edge
TextYStep = 20; // Height of lines
FontSize = 10; // Size of the font
TextColor = Blue; // Color of the text
UpColor = Green; // Color for rising prices
DnColor = Red; // Color for falling prices
Important Note: Ensure that instruments in the list are separated by a space. To change the period, write it directly after the instrument without a space. To disable an instrument, simply add a minus sign (-) before it.
For example:
Instruments = "EURUSD240 EURUSD60 EURUSD30 -EURUSD15" will display EURUSD charts for H4, H1, and M30 periods only.
You can even hide the original instrument window by using a simple SMA with a period of 1 and matching the background color when switching the chart to line mode.
Quick Reminder:
Remember NOT to trade directly from this window!
This is crucial to avoid accidental trades, especially when you have the original instrument displayed here.
The multi-chart updates with new ticks from the original instrument or can be refreshed manually.
Lastly, there's still plenty of space on your chart to add more text labels for displaying vital information. I've commented out a couple of lines in the LABELS block for you to customize:
/// LABELS
string Text = DoubleToStr(c, Digits);
DrawText(LName+"_1", Time[B-6], WindowPriceMin()+TextY*Point, Symb, 0, TextColor, FontSize, 0);
// You can add more labels as needed
In Summary
Here you have it, your new universal tool for exploring and conquering the market!
Happy trading, and may your charts be ever in your favor!


Comments 0