Understanding the 2MA Strategy
If you're looking to sharpen your trading skills, the 2MA (Two Moving Averages) strategy is a fantastic approach to consider. Here’s the lowdown on how it works and how you can use it to make better trading decisions.
How It Works
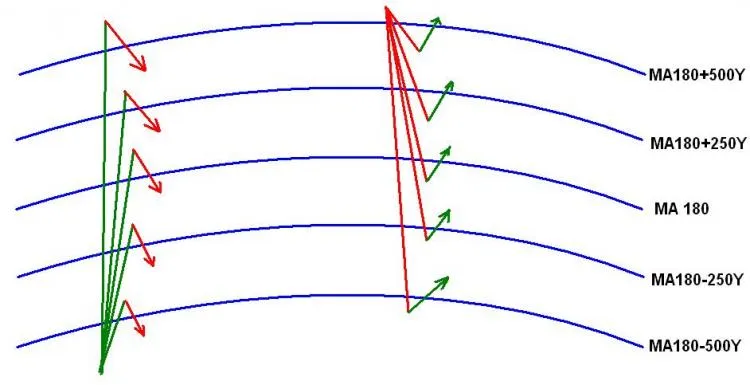
This strategy employs two Simple Moving Averages (SMA): one with a period of 14 and the other with a period of 180. Think of these as your guiding lines in the market. When the fast MA crosses any of the slow MA lines, it signals a potential Buy or Sell opportunity.
Parallel Lines for Better Clarity
Besides the main MAs, this strategy also incorporates parallel lines to help you visualize the market better. Here are the key levels to keep an eye on:
- SMA 180 + 250 points on Y
- SMA 180 + 500 points on Y
- SMA 180 - 250 points on Y
- SMA 180 - 500 points on Y
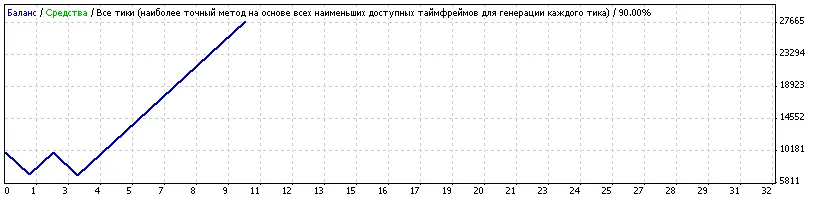
Strategy Performance Overview
Let’s take a closer look at the performance metrics for this strategy using the EURUSD pair over a one-hour timeframe:
| Symbol | EURUSD (Euro vs US Dollar) | ||||
| Period | 1 Hour (H1) from 2009.02.19 00:00 to 2009.03.18 23:00 | ||||
| Model | Every tick (the most accurate mode) | ||||
| Parameters | Take Profit: 1000; Stop Loss: 1000; Lots: 3 | ||||
| Initial Deposit | £10,000.00 | Total Net Profit | £17,882.10 | ||
| Profit Factor | 3.93 | Expected Payoff | £1,788.21 | ||
| Total Trades | 10 | Winning Trades | 8 (80.00%) | Losing Trades | 2 (20.00%) |

Final Thoughts
The 2MA strategy can be an effective tool in your trading arsenal. With clear signals and a structured approach, you can navigate the market with greater confidence. Remember, practice makes perfect, so don't hesitate to backtest your strategy before diving into live trading!


Comments 0