Hey fellow traders! Today, we're diving into the world of Fibonacci levels, a powerful tool for those of us using MetaTrader 4.
So, what exactly are Fibonacci levels? Essentially, they're horizontal lines that represent key support and resistance levels on your charts. These levels are calculated based on the highest high and the lowest low over a series of bars that you specify in the indicator settings.
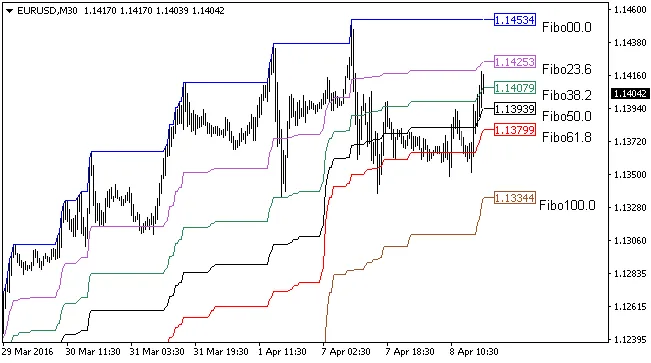
As you can see in the image above, the Fibonacci lines are shifted by 3 bars. But don’t worry—you can easily adjust this shifting in the input settings to better suit your trading style.
Here’s a quick rundown on how to set it up:
- Input the number of bars: Determine how many bars you want to include in your calculations.
- Adjust the shift: Change the bar shift to see how it affects your levels.
- Analyze your charts: Look for significant levels where price action may reverse or continue.
Remember, Fibonacci levels aren’t just numbers—they're a way to understand market psychology. Use them wisely, and they can become a valuable part of your trading toolkit!


Comments 0