Understanding Mean Reversion in Trading
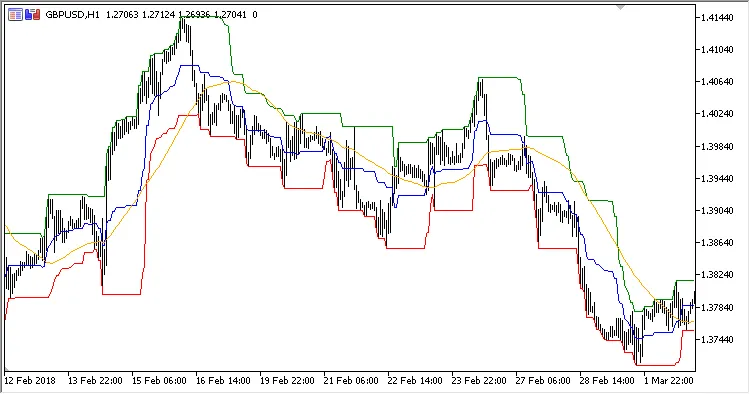
If you're diving into the world of trading, you've likely come across the term 'mean reversion.' This nifty channel indicator is a valuable tool that can help you identify potential entry points in the market. It displays a channel on your price chart, consisting of three lines and a moving average, guiding your trading decisions.
Key Features of the Mean Reversion Indicator
The Mean Reversion indicator comes with two adjustable parameters that you’ll want to keep an eye on:
- Range: This parameter determines the calculation range for the channel.
- MA Period: This sets the period for the Moving Average you’ll be using.
How is it Calculated?
Understanding the calculations behind the indicator can give you an edge:
Highest = Max
Lowest = Min
Median = (Max + Min) / 2
MovAvg = SMA(Close, MA period)
Where:
Max and Min refer to the highest and lowest prices within the specified Range.
Using Mean Reversion in Your Trading Strategy
Once the channel hits an extreme value, it’s time to consider opening a position. You can either trade in the direction indicated by the moving average or aim for the channel center. This approach is particularly useful for counter-trend strategies, as it anticipates the price's return to its average value.


Comments 0