If you're looking to up your trading game, understanding how to forecast price ranges can be a game-changer. Inspired by the insights from Thomas R. Demark's book, "The New Science of Technical Analysis," I've found that using your own calculations can significantly enhance your daily price predictions.
Demark emphasizes the importance of relying on the data from a single daily bar. This method isn't just limited to daily charts; you can easily apply it to other time frames, making it versatile for your trading style!
The nifty indicator we use actually highlights a colored region before each bar, representing the expected price range for the upcoming bar. This visual can help you make more informed decisions about your trades.
Check out the indicator in action:
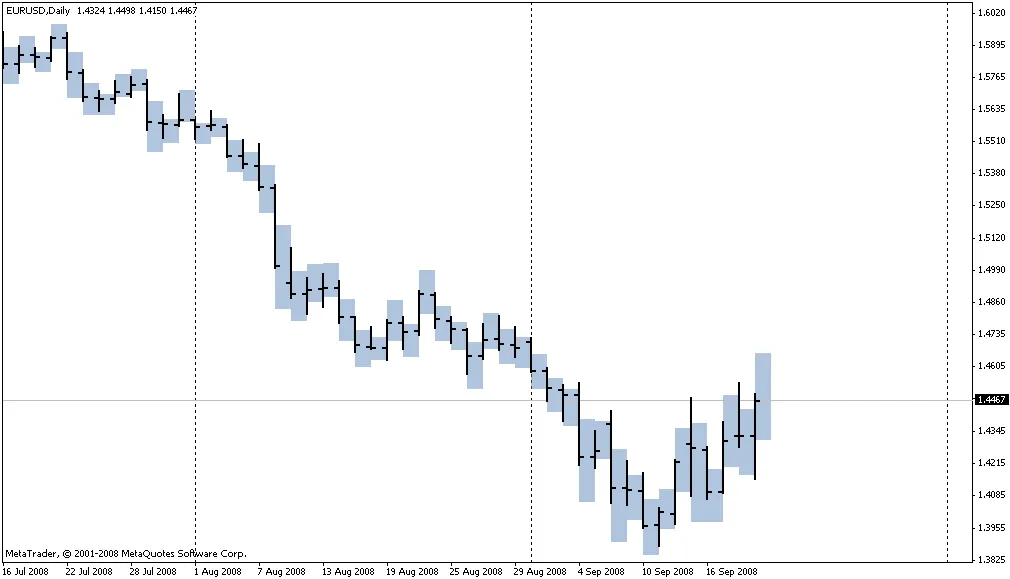
Forecasting of Price Ranges
A big shoutout to WWer for the help in bringing this idea to life!


Comments 0