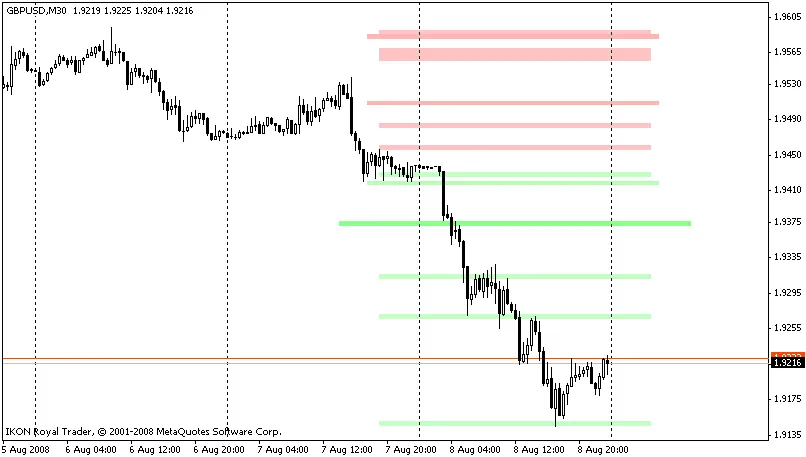
Are you ready to elevate your trading game? The Waddah Attar Super Indicator is here to help you identify over 160 different support and resistance levels with ease.
This powerful tool classifies these levels using a simple color gradient of red and green, making it visually appealing and highly functional.
Let’s break it down:
- Strong Levels: The indicator highlights 63 strong levels on daily, weekly, and monthly charts.
- Hidden Levels: It identifies 21 hidden levels across the same timeframes.
- RSI Saturation Levels: With 11 RSI levels displayed, you can easily gauge market strength.
- Pivot Levels: The indicator shows 33 pivot levels, complete with support and resistance for each one.
- Camarilla Levels: You’ll also find 24 camarilla levels with their respective support and resistance.
- High and Low Levels: Finally, it tracks 9 levels for daily, weekly, and monthly highs and lows.
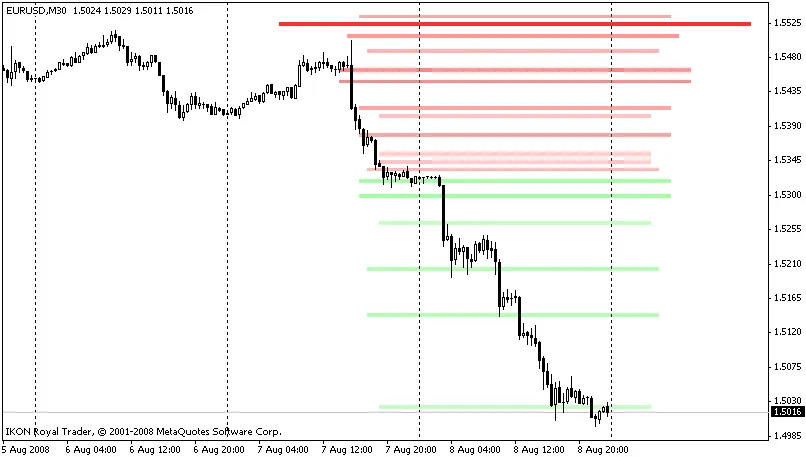
The beauty of this indicator is its flexibility. You can easily control which sets of levels to display or hide, allowing you to customize your trading view. Additionally, you can adjust the thickness of the lines representing these levels to better differentiate their strengths.
Want to know how to visualize these levels? The indicator allows you to see whether a price level is acting as support or resistance based on whether it's been broken. And with the AutoSupRes feature, you can dictate how you want these levels to appear based on current market dynamics.
Lastly, if you want to focus on the stronger combined levels, you can easily adjust the settings to hide the weaker ones. This way, you can keep your chart clean and your focus sharp.

With the Waddah Attar Super Indicator at your disposal, navigating the markets has never been easier. Happy trading!


Comments 0