The Klinger Oscillator, often referred to as KVO, is a powerful tool developed by Stephen Klinger that helps traders gauge market trends through turnover analysis. If you’re looking to add an edge to your trading strategy, this oscillator can provide valuable insights.
Here’s a simple breakdown of how the Klinger Oscillator is calculated:
- First up, we calculate the average typical price using the formula: (High + Low + Close) / 3.
- If the current typical price is higher than the average typical price from the previous bar, we assign a “plus” sign to the turnover of the current bar.
- Conversely, if the current typical price is lower than the average typical price of the previous bar, we give the current bar’s turnover a “minus” sign.
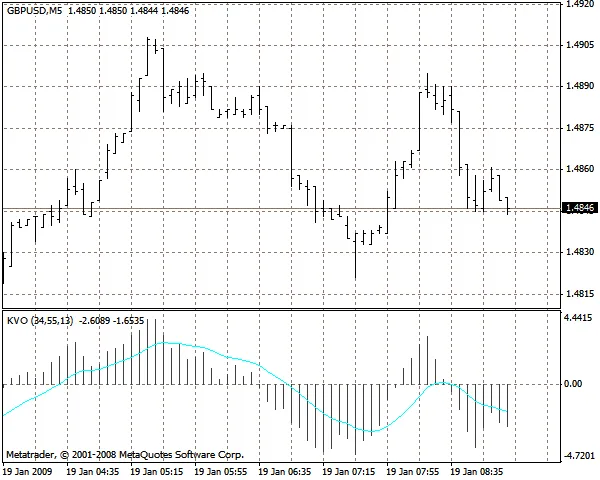
- Next, we calculate a 34-period Exponential Moving Average (EMA) based on the turnover from the previous steps.
- We then compute a 55-period EMA of the same turnover.
- The final step involves subtracting the 34-period EMA from the 55-period EMA. This result is represented on your chart as a histogram.
- Lastly, we calculate the EMA of the difference obtained in the previous step and plot it on the chart.
By understanding these steps, you’ll be well on your way to effectively utilizing the Klinger Oscillator in your trading arsenal. Happy trading, and may your charts always be in your favor!


Comments 0