The LRMA BB, or Linear Regression Moving Average with Bollinger Bands, is a powerful tool that can enhance your trading strategy. This indicator combines the linear regression method with Bollinger Bands to help you identify trends and price volatility effectively.
Let’s break down how this indicator works and how you can use it to your advantage:
Understanding LRMA BB
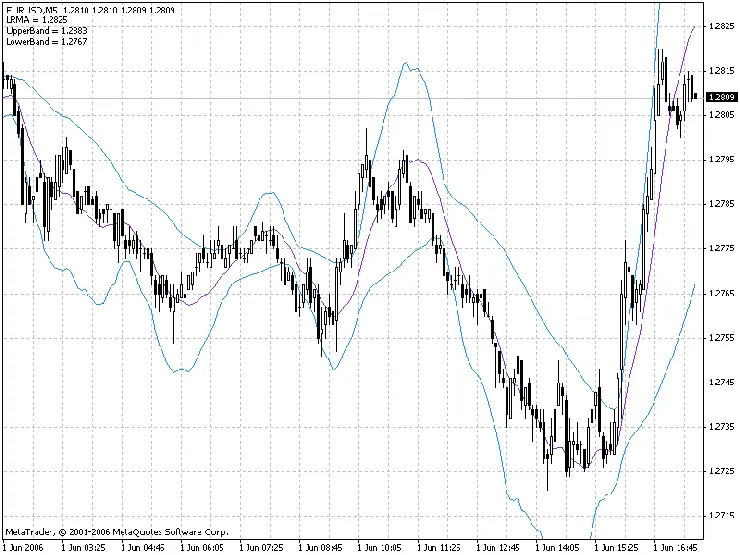
- Linear Regression Moving Average: This component calculates the average price over a specified period, smoothing out fluctuations and giving you a clearer picture of the trend.
- Bollinger Bands: These bands are set a certain number of standard deviations away from the moving average, providing insight into price volatility. When prices touch or exceed these bands, it can signal potential reversals or breakouts.
By using LRMA BB, you can spot potential entry and exit points more accurately. Keep an eye on the relationship between the price and the bands, as this can guide your trading decisions.
Incorporating the LRMA BB into your trading toolkit could be just what you need to up your game and navigate the markets with confidence!


Comments 0