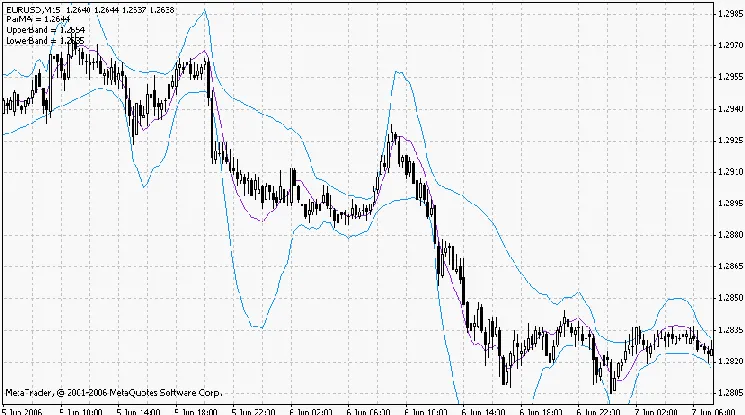
Have you ever heard of ParMA BB? It's a unique indicator that combines the power of parabolic regression with Bollinger Bands to help traders make informed decisions.
In the chart above, you can see a comparison between the ParMA BB and the traditional LRMA (depicted by the red line). For clarity, we've turned off the Bollinger Bands.
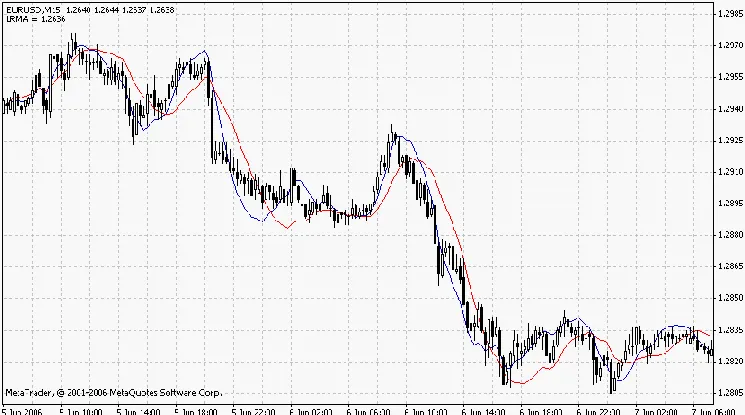
What stands out here is that with the same selection size of 30, the ParMA BB shows less lag compared to the LRMA, while still capturing the price fluctuations effectively.
Now, a little note for the coding enthusiasts: the calculation for the parabolic regression was adapted from a classic reference:
V.P. Dyakonov, "Reference Book on Algorithms and Programs in BASIC for Personal Computers," Moscow, "Nauka," 1987.
We kept it untouched to maintain the integrity of the code.
So, if you're looking to enhance your trading toolkit, give ParMA BB a shot. It might just be the edge you need in the fast-paced world of trading!


Comments 0