Hey there, fellow traders! Today, let's dive into an essential indicator that can help you navigate the markets more effectively: the Volatility vs. Range indicator for MetaTrader 5. This tool can significantly enhance your trading strategy, so let’s break it down.
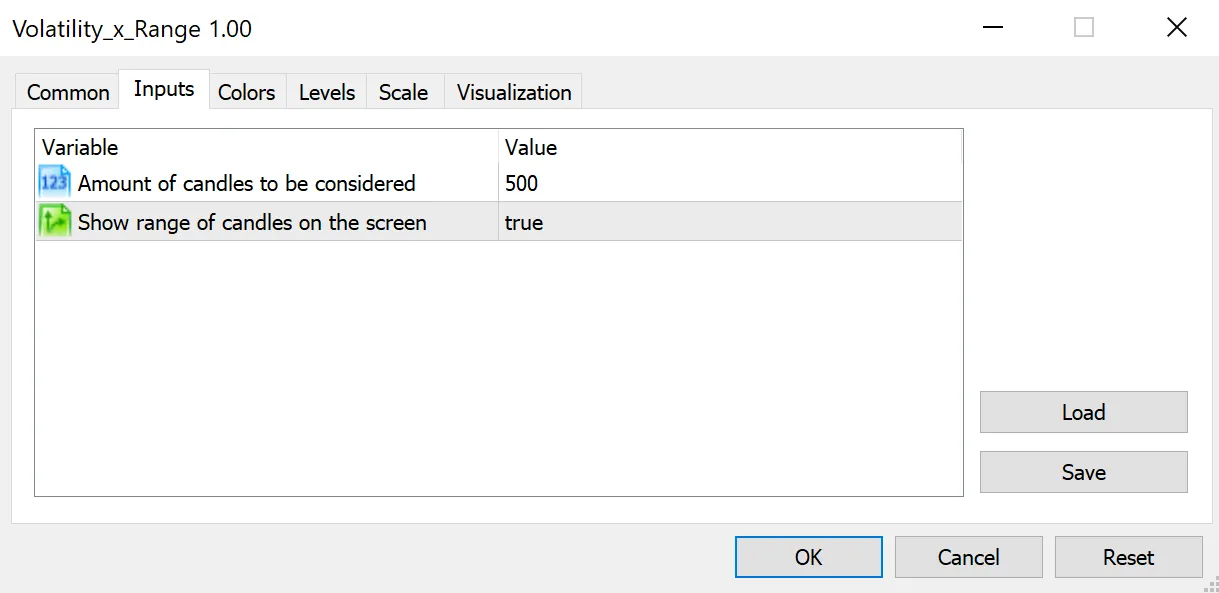
This indicator calculates the price range by dividing it by the total number of candles over a user-defined period. It’s pretty straightforward and has only two key inputs:
- The number of candles you want to analyze.
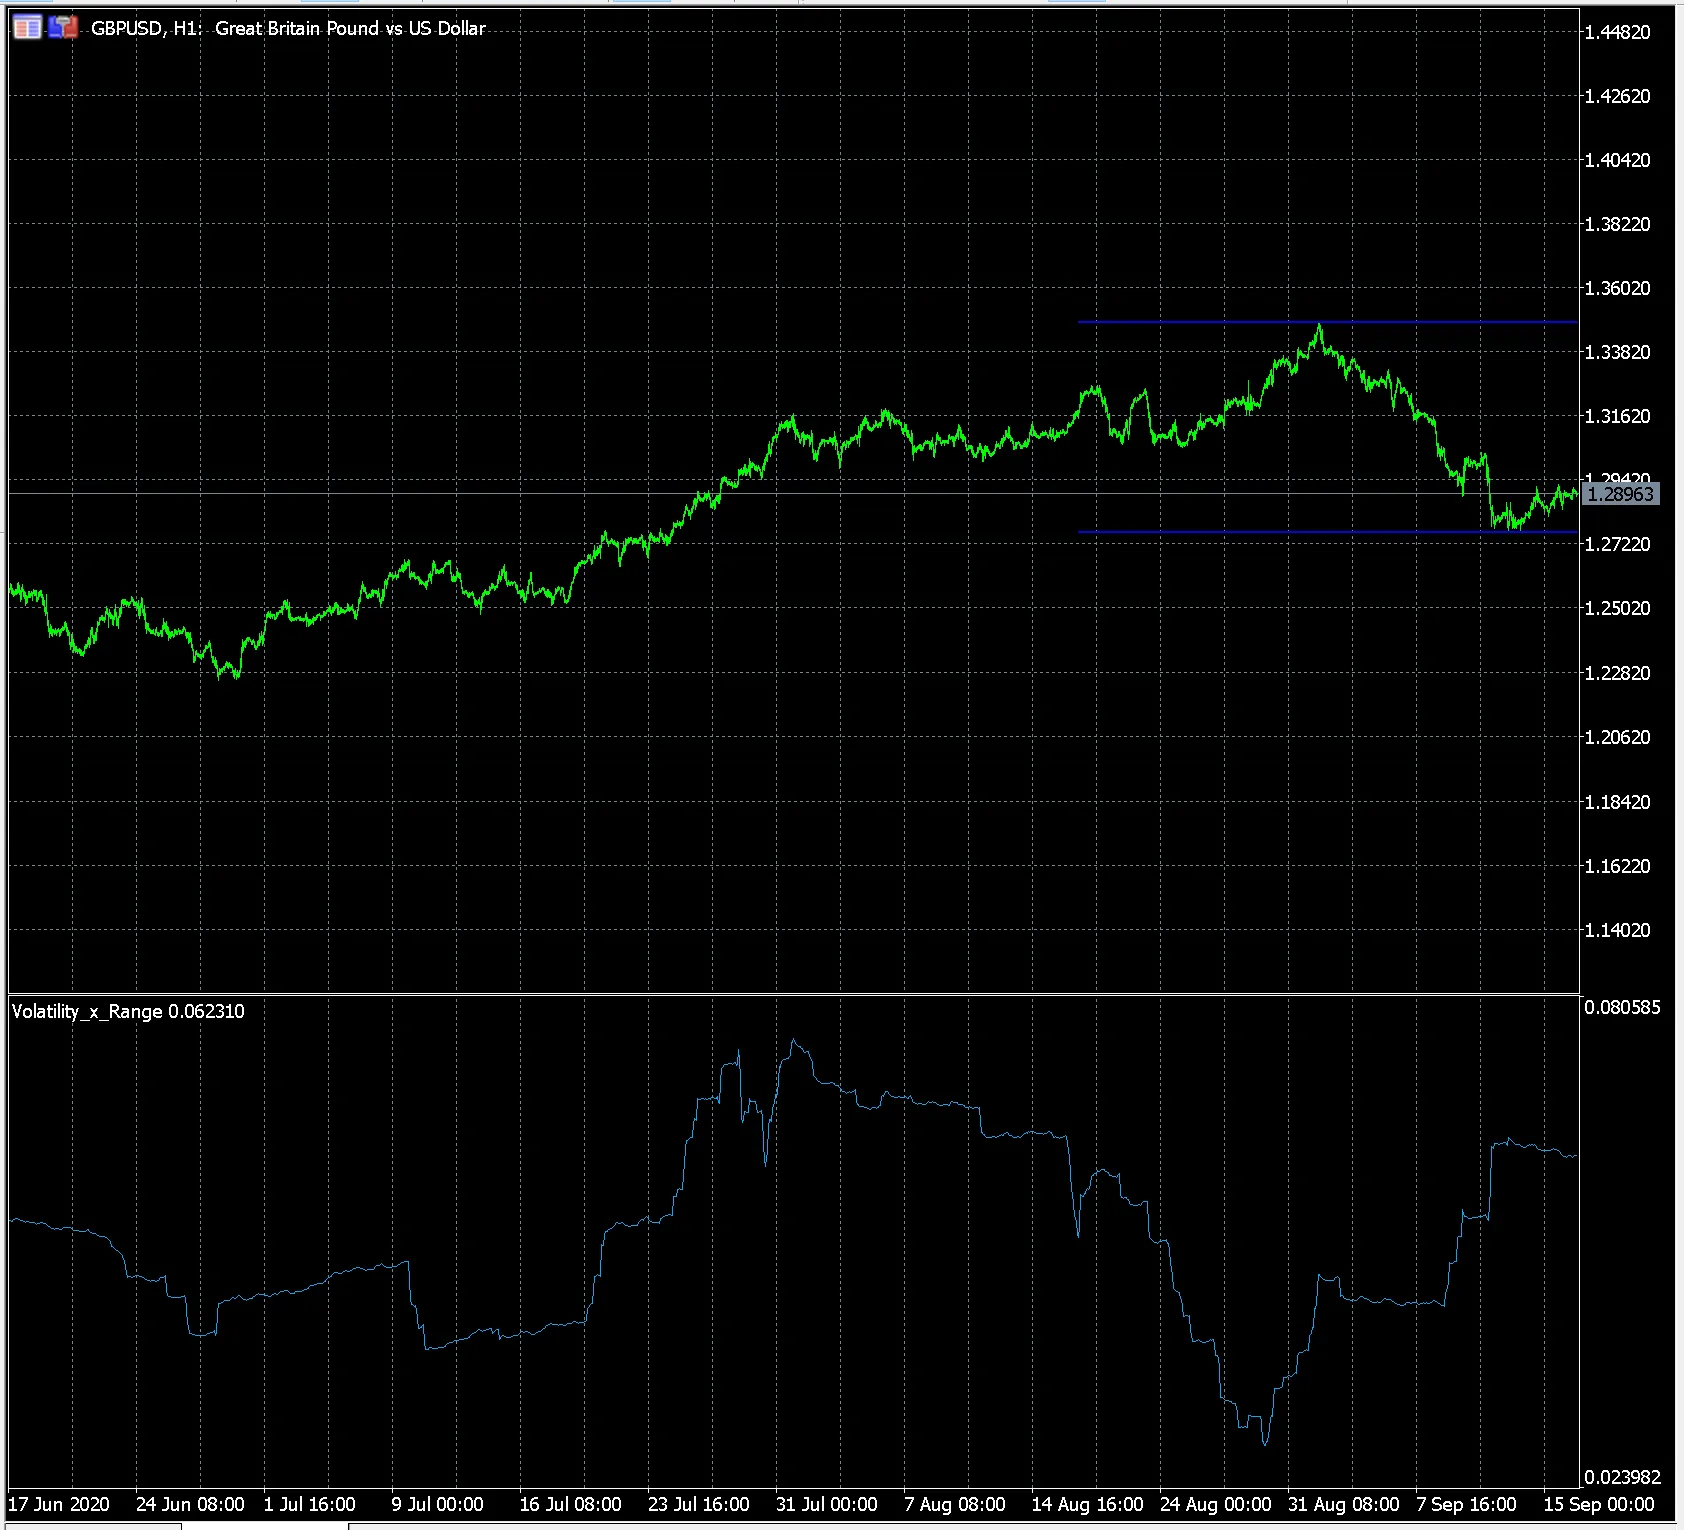
- Whether or not to display the range visually on the chart (indicated by blue horizontal lines).
The main output of this indicator appears on a separate screen and provides valuable insights:
- Lower values, closer to 0, indicate consolidation zones where the price oscillates within a tight range. This is great news for scalping EAs, Grid EAs, or any trading strategies that thrive on price bouncing back and forth.
- On the flip side, higher values, approaching 1, suggest that the price is breaking out, indicating a potential new trend is forming.
In conclusion, understanding how to use the Volatility vs. Range indicator can give you a solid edge in your trading. Whether you’re a scalper or a trend trader, this tool has something to offer. So why not give it a shot? Happy trading!


Comments 0