Description:
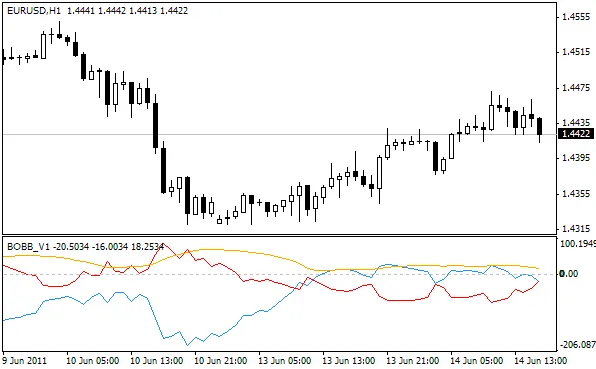
Hey fellow traders! Today, I want to introduce you to an exciting tool for your trading arsenal: the BOBB indicator for MetaTrader 4. My goal was to create an indicator that highlights Bollinger Bands® breakouts while also showcasing the width of those bands. The first version (v1) includes a handy orange line that represents the band width.
Here's how it works: when the blue line crosses above the zero line, it's a signal for a bullish breakout. Conversely, if the red line crosses the zero line to the upside, that indicates a bearish breakout.
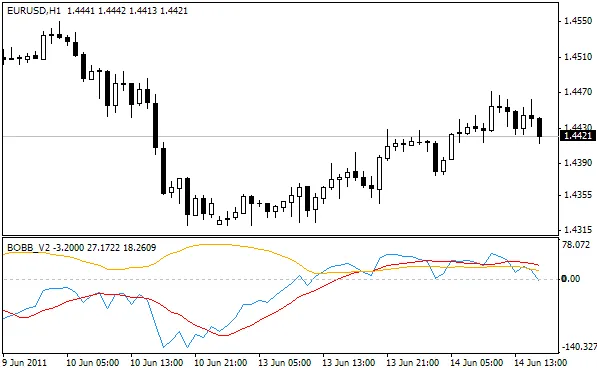
After getting some great signals from the crossover of these two lines, I decided to take it up a notch with a version 2 (v2). This iteration includes the difference between the two lines along with a moving average (MA).
- The orange line remains the same as in v1.
- The blue line now shows the difference between the two lines from v1.
- A crossing below the zero line signals a short position, while a crossing above indicates a long position.
- The red line represents the moving average.
Once I completed the coding, I noticed that the blue line effectively displays the difference between price and the 20-period moving average. Despite this, it generates solid signals whether you're trading based on the zero line crossover or the moving average. Plus, there are some useful divergences to consider!
Wishing you all successful trading!


Comments 0