If you're looking to elevate your trading game, the Investor Preference Index (IPI) is an indicator worth your attention. Originally discussed in the December 1997 issue of Technical Analysis of Stocks & Commodities by Cyril V. Smith Jr., this tool was designed to enhance long-term stock market investments by comparing the S&P 500 to the New York Stock Exchange to gauge investor sentiment.
At its core, the IPI operates on the theory that investors have preferences for specific types of investments. Let's dive into the essential parameters you need to know to get started:
- Instrument - This refers to the financial instrument you’re analyzing.
- ROC period - This is the time frame used to calculate the price rate of change.
- Fast smoothing period - The duration for quick smoothing of data.
- Slow smoothing period - The period for slower data smoothing.
- Result smoothing period - This is the time frame for smoothing the final output.
Calculation:
IPI = 100.0 * (Result smoothing period * SMA(B2, Result smoothing period) + 1.0)
Where:
B2 = SMA(B1, Fast smoothing period) - SMA(B1, Slow smoothing period)
B1 = ROC1 - ROC2
ROC1 - Current symbol's price rate of change over the ROC period
ROC2 - Instrument's price rate of change over the ROC period
ROC = 100.0 * Log(Close - Log2) / Log2
Log2 = Log(Close[ROC period])
Keep in mind that for the IPI to function correctly, you'll need historical data for the 'Instrument' symbol. This requirement can cause a slight delay in displaying the oscillator line during your first use or when you switch symbols.
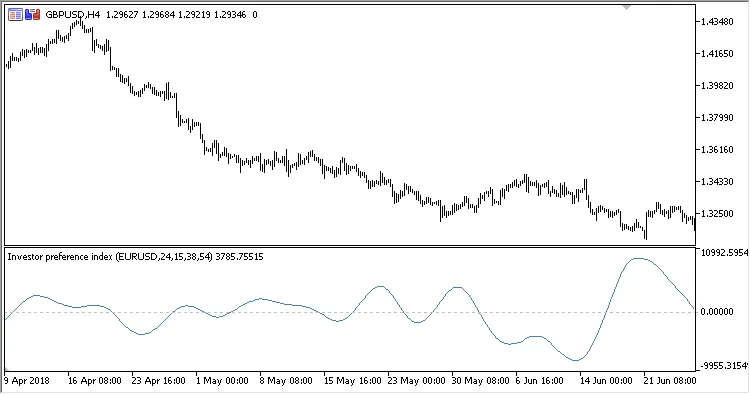
Fig. 1. Investor Preference Index GBPUSD relative to EURUSD
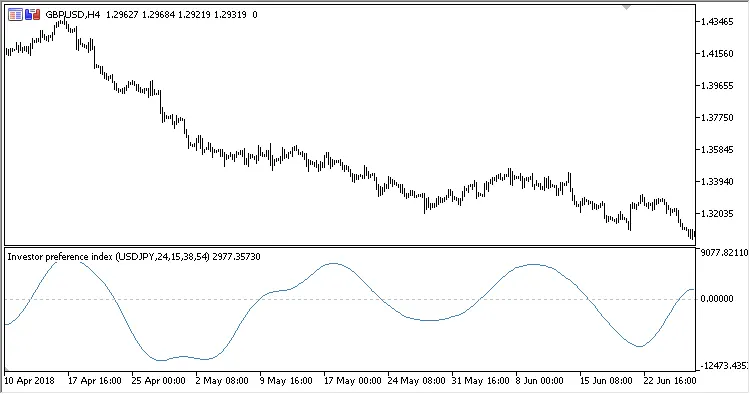
Fig. 2. Investor Preference Index GBPUSD relative to USDJPY
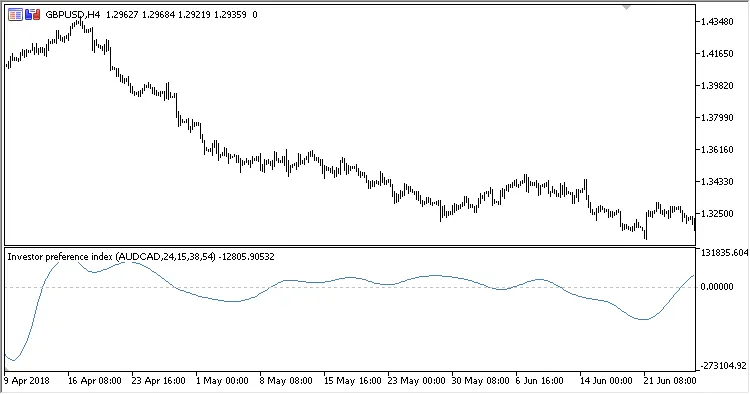
Fig. 3. Investor Preference Index GBPUSD relative to AUDCAD
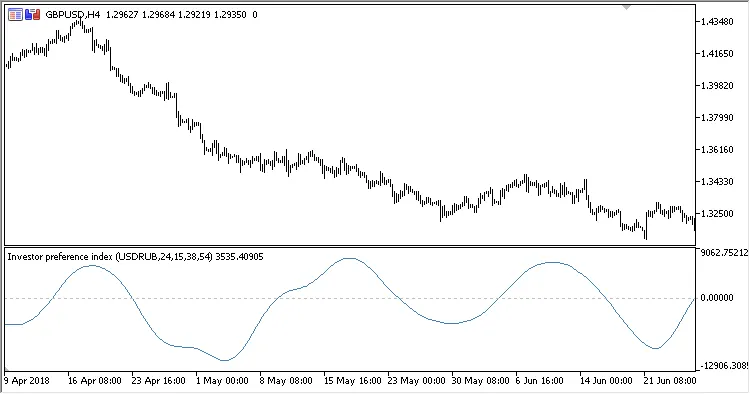
Fig. 4. Investor Preference Index GBPUSD relative to USDRUB


Comments 0