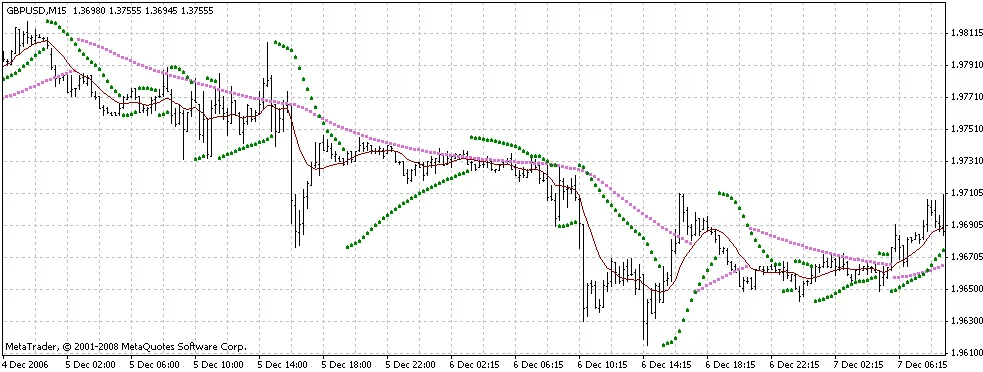
The above image showcases the effectiveness of the Ma_Parabolic_st2 indicator, especially when compared to the standard Parabolic SAR indicator. You can see how the two indicators behave differently under varying market conditions.
In this comparison, the purple dotted line represents the Ma_Parabolic, while the green dotted line depicts the standard Parabolic SAR. As traders, understanding these visual cues can significantly enhance our decision-making.
With the latest update, version 2.1, we've tackled some display issues that occurred on charts with a smaller number of bars. Previously, the parabolic chains weren't visible when the "Step" value was around 0.001 or less, especially with around 300 bars. This fix is a game changer for those of us who often analyze shorter time frames.
Furthermore, in version Ma-Parabolic_st2.2, we've introduced the ability to differentiate between the inclinations of the rising and falling lines. This enhancement allows for a more nuanced approach to market analysis, giving traders like us better insights into momentum shifts.

Ma-Parabolic_st2_2 with different inclination of lines


Comments 0