Hey there, fellow traders!
Today, I want to dive into a handy tool called MultiMA. This nifty setup allows you to display up to three Moving Averages (MAs) from different timeframes all on your chosen timeframe. It’s a game-changer for those of us who like to keep an eye on multiple perspectives at once.
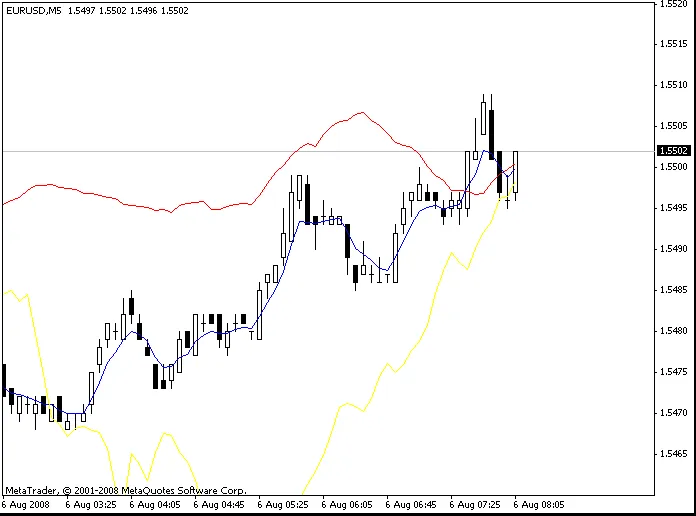
For instance, in the image above, we’re looking at the M5 timeframe, but we can also see the MAs for M1 and M15 right on the same chart. This way, you can make more informed decisions based on a broader view of the market.
Here's how it works:
- MA_Period: This is where you set the timeframe you want to track in minutes.
- MA: This represents the Calculation Period for the Moving Average.
So, if you’re on the M15 chart and want to view the 30 MA from the M5, you’d enter MA_Period_x as 15 and MAx as 30.
Feel free to drop your thoughts or questions in the comments below! Your feedback helps us all grow as traders.
Happy trading!


Comments 0