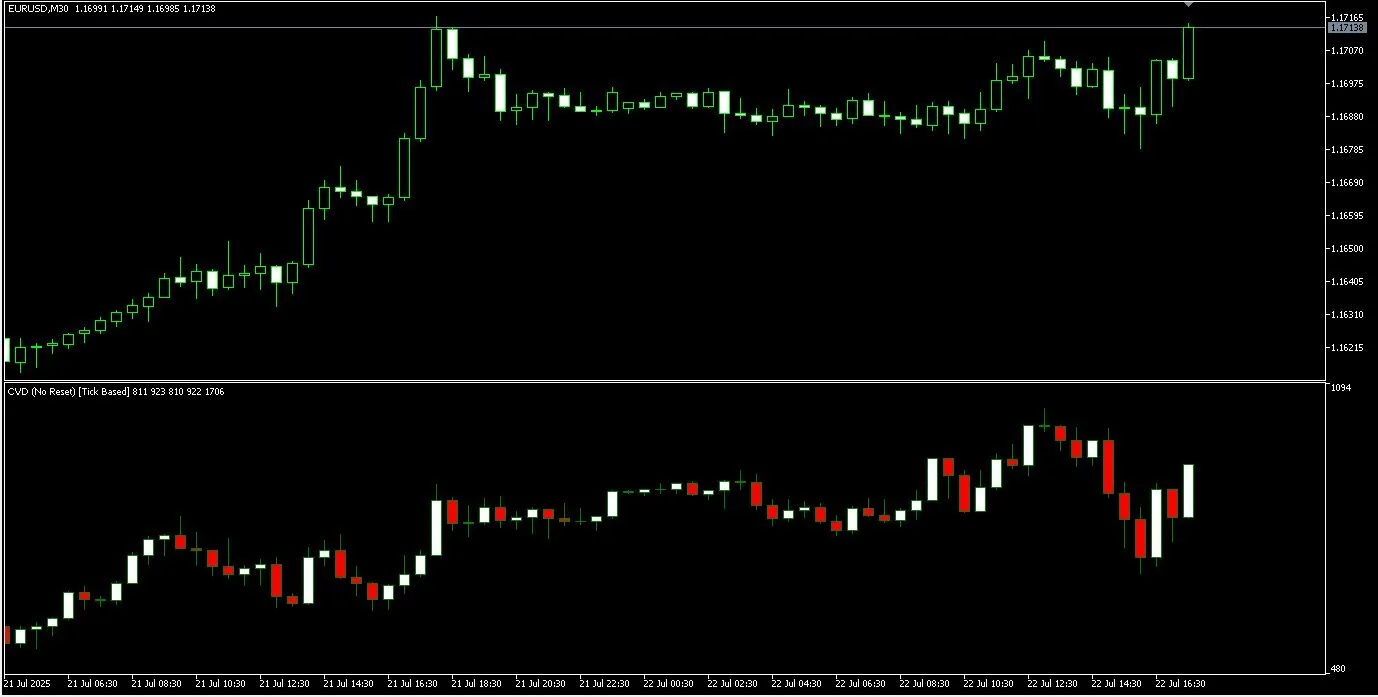
Looking to sharpen your trading edge? The Cumulative Volume Delta (CVD) indicator for MetaTrader 5 i...
Hey there, fellow traders! Today, let’s dive into the Price/Volume Indicator available on MetaTrade...
The RSI MA Signal Indicator is a straightforward yet powerful tool for MetaTrader 5, perfect for tra...
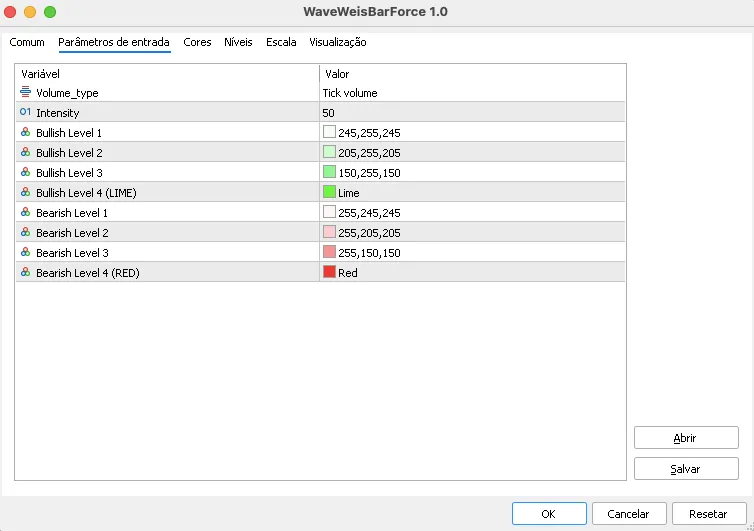
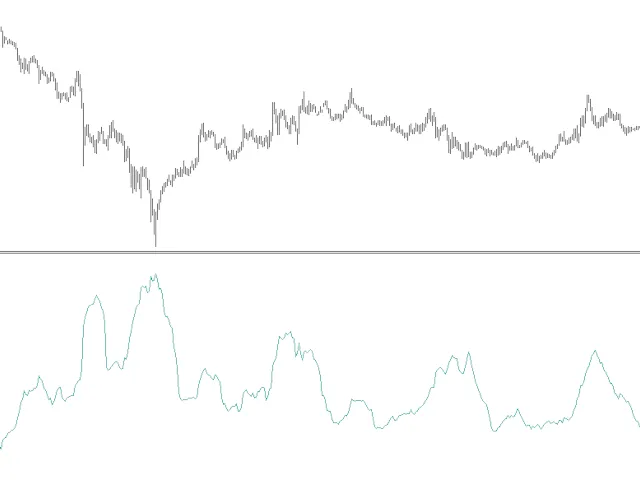
Wave Weis Bar Force: Understanding Accumulated Wave Volume Wave Weis Bar Force is a powerful indicat...
Good morning, fellow traders! If you run into any issues with this code, whether it’s a glitch or du...
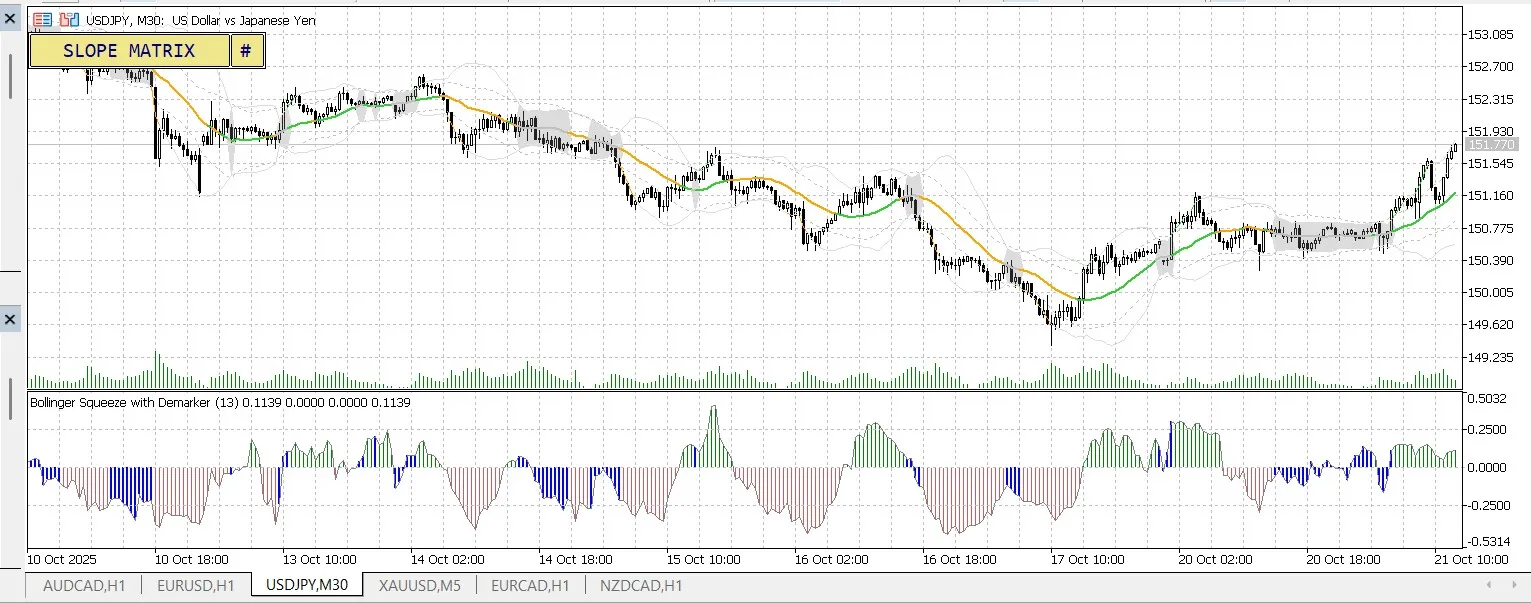
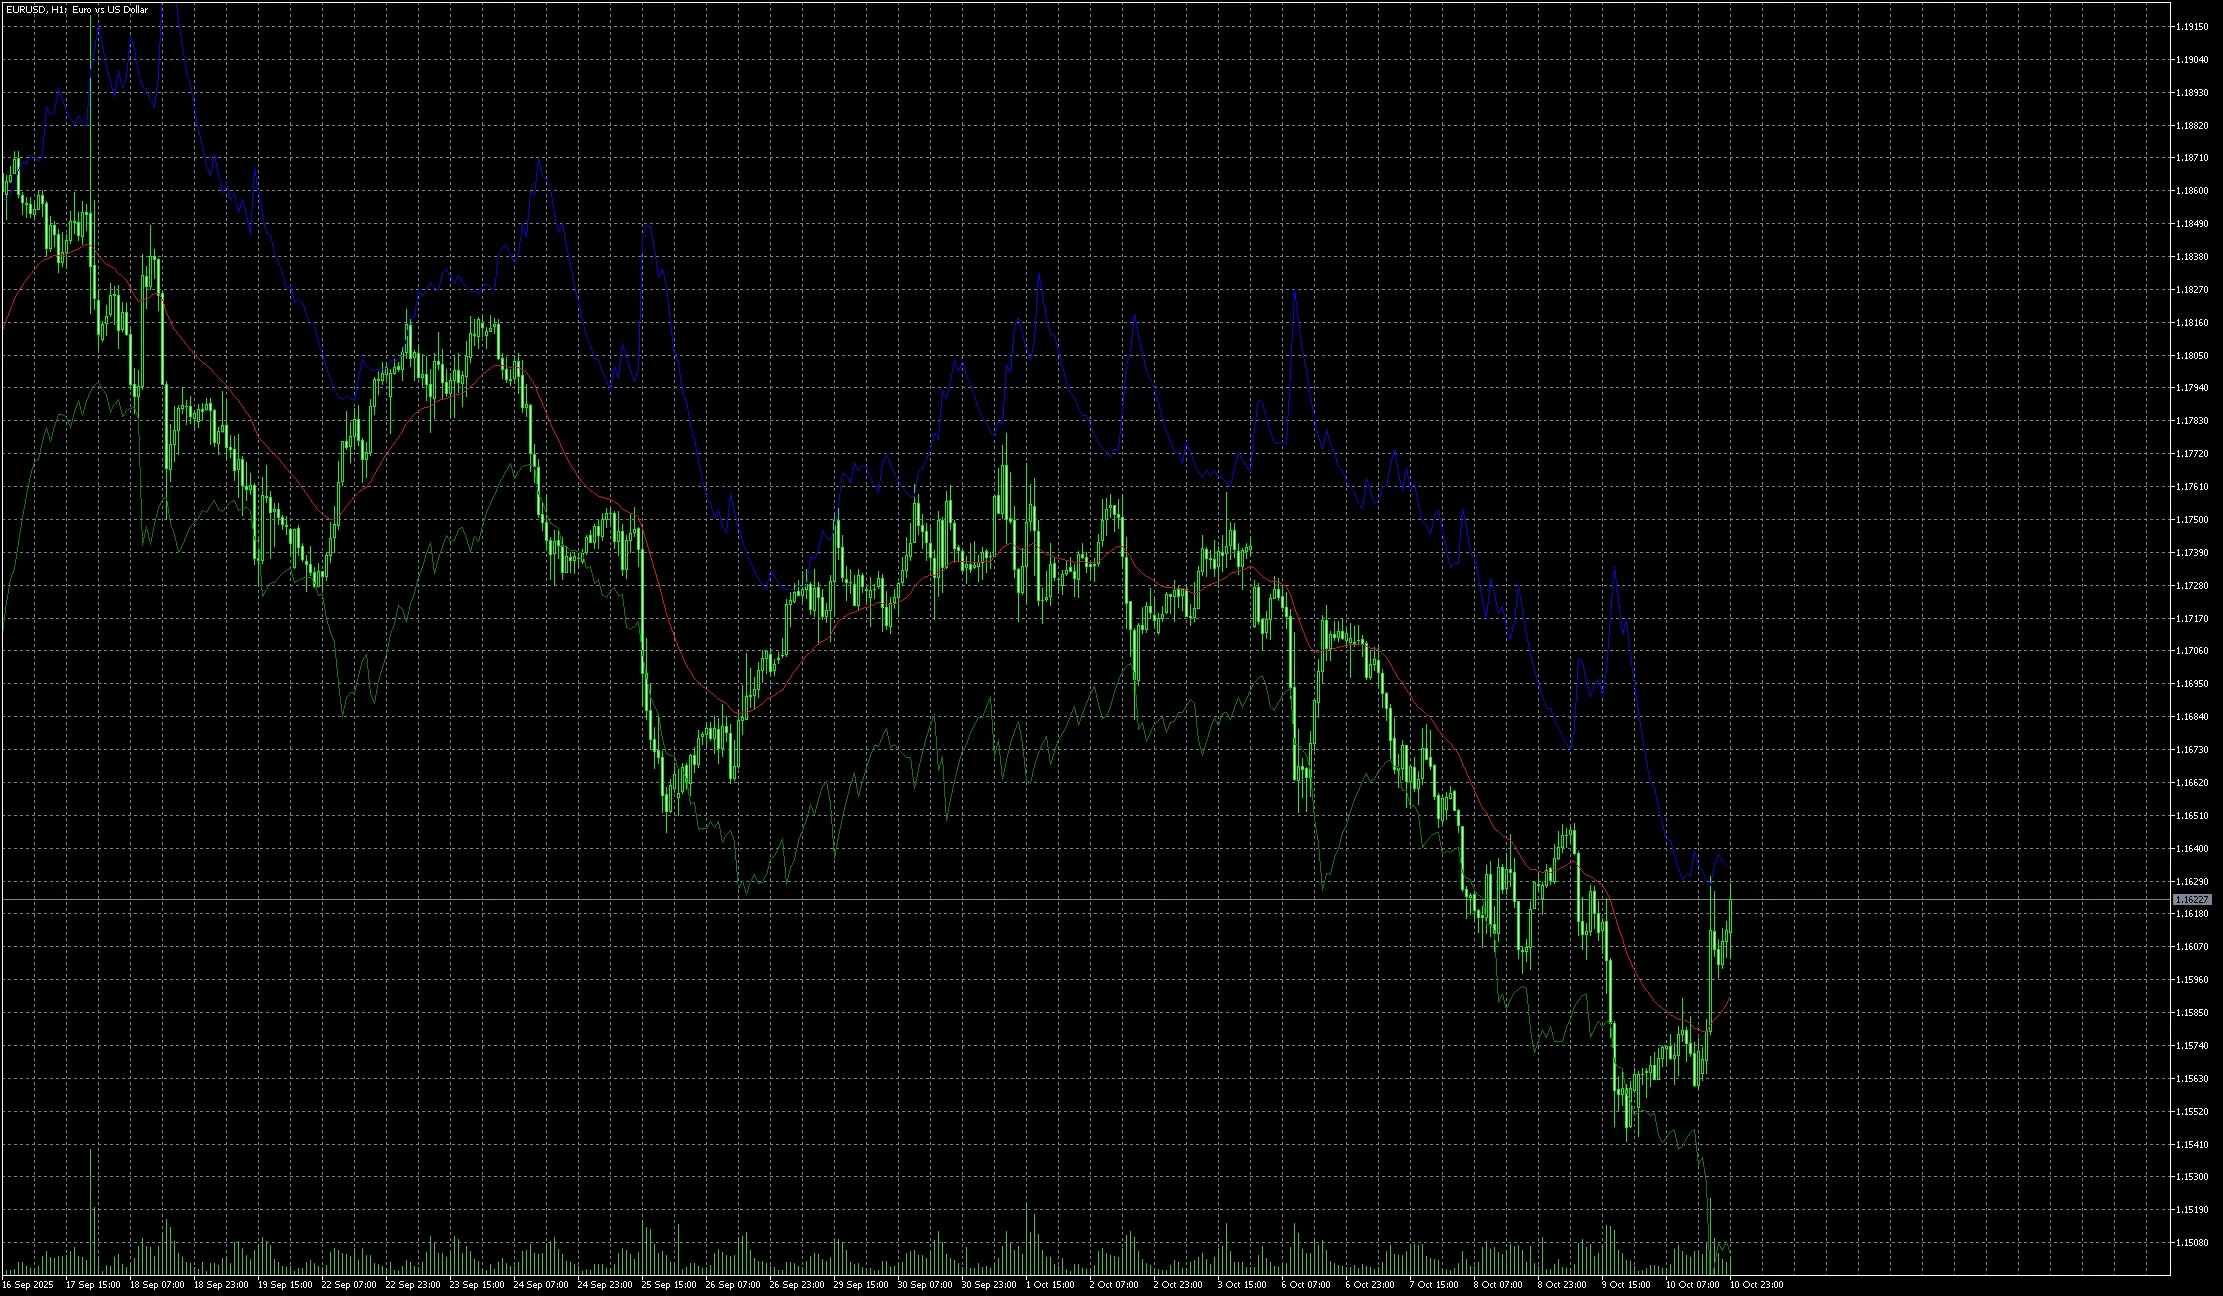
Bollinger Bands Squeeze - The Calm Before the Storm The Bollinger Bands Squeeze is one of the most p...
1. What is the MACD Histogram?The MACD Histogram (also known as MACD-H) is the bar chart component o...
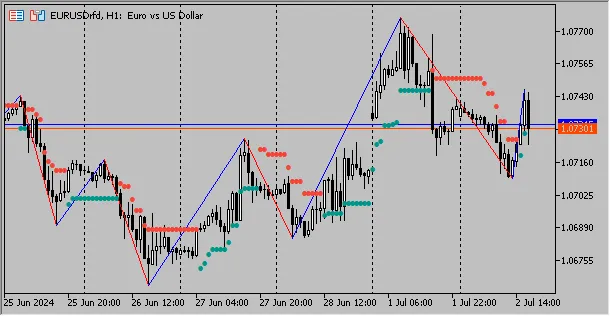
If you’re like me and enjoy using the Volatility Stop indicator, you’ll definitely want to check out...
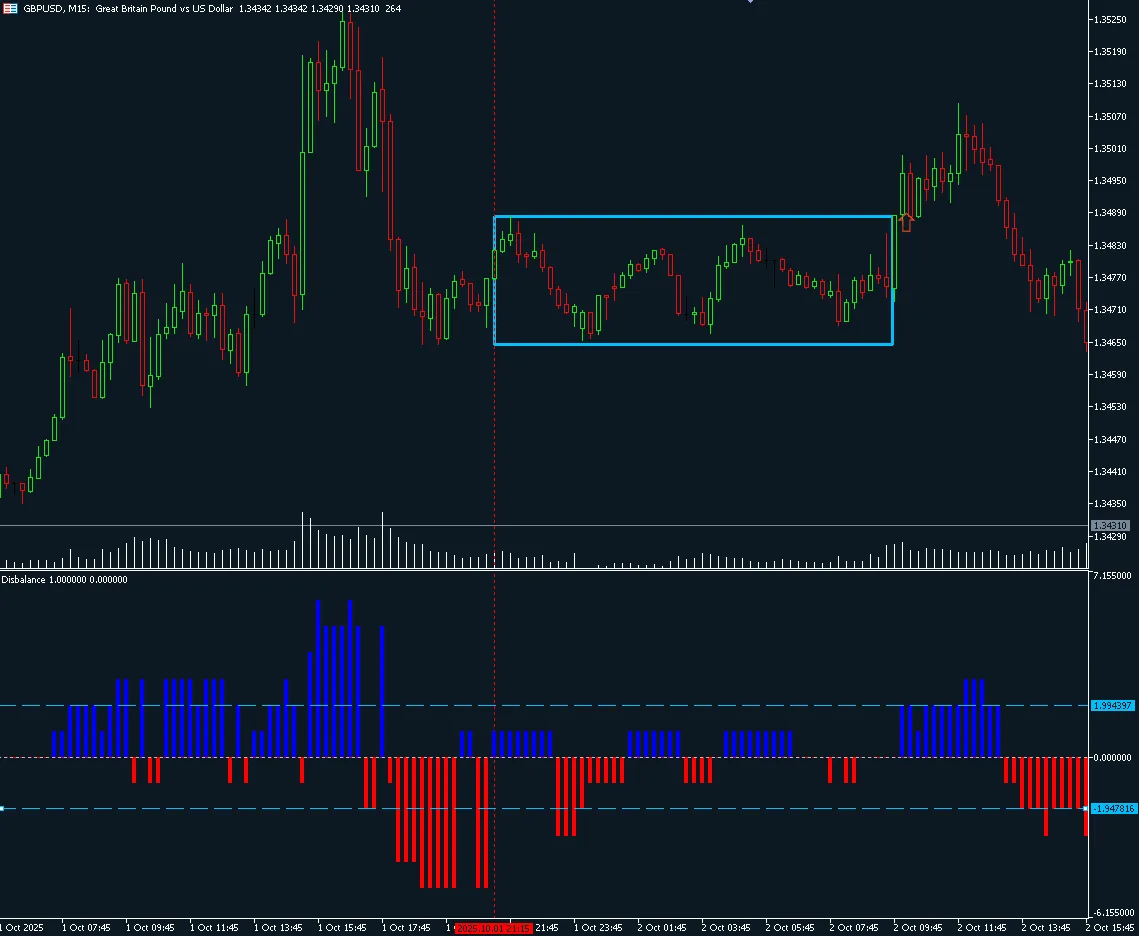
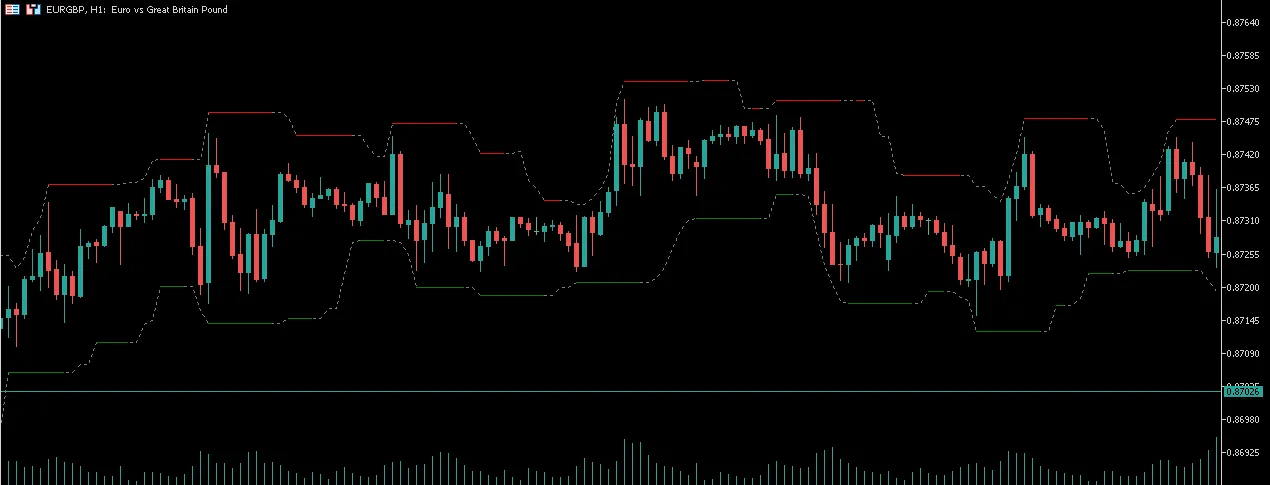
If you’re looking to sharpen your trading strategy, understanding market consolidation is key. The C...
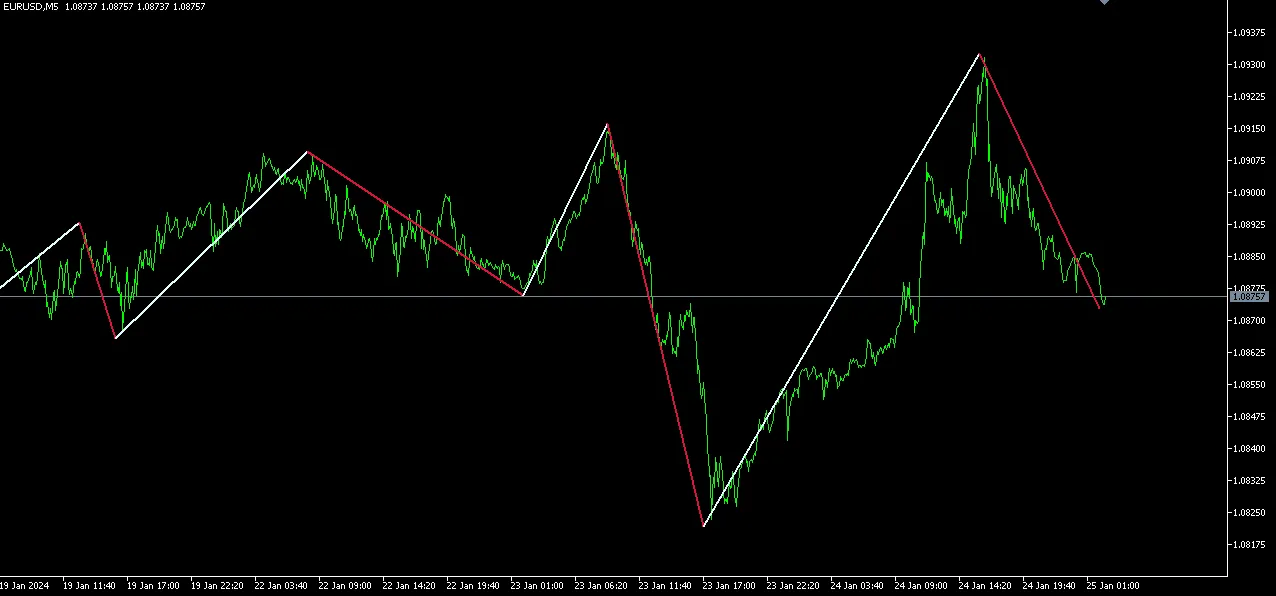
If you’re looking to enhance your trading strategy, the Zigzag Custom Timeframe indicator for MetaTr...
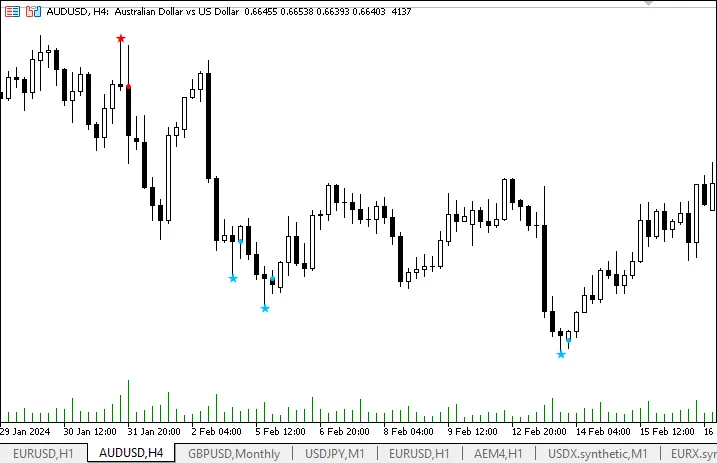
What is a Pin Bar? A Pin Bar is a specific type of candlestick that features a small body and an elo...
Unlocking the Power of Reverse Engineered RSI Have you ever wanted to see how the Relative Strength...
Are you looking to streamline your trading strategy? The TakeStop indicator for MetaTrader 4 is here...
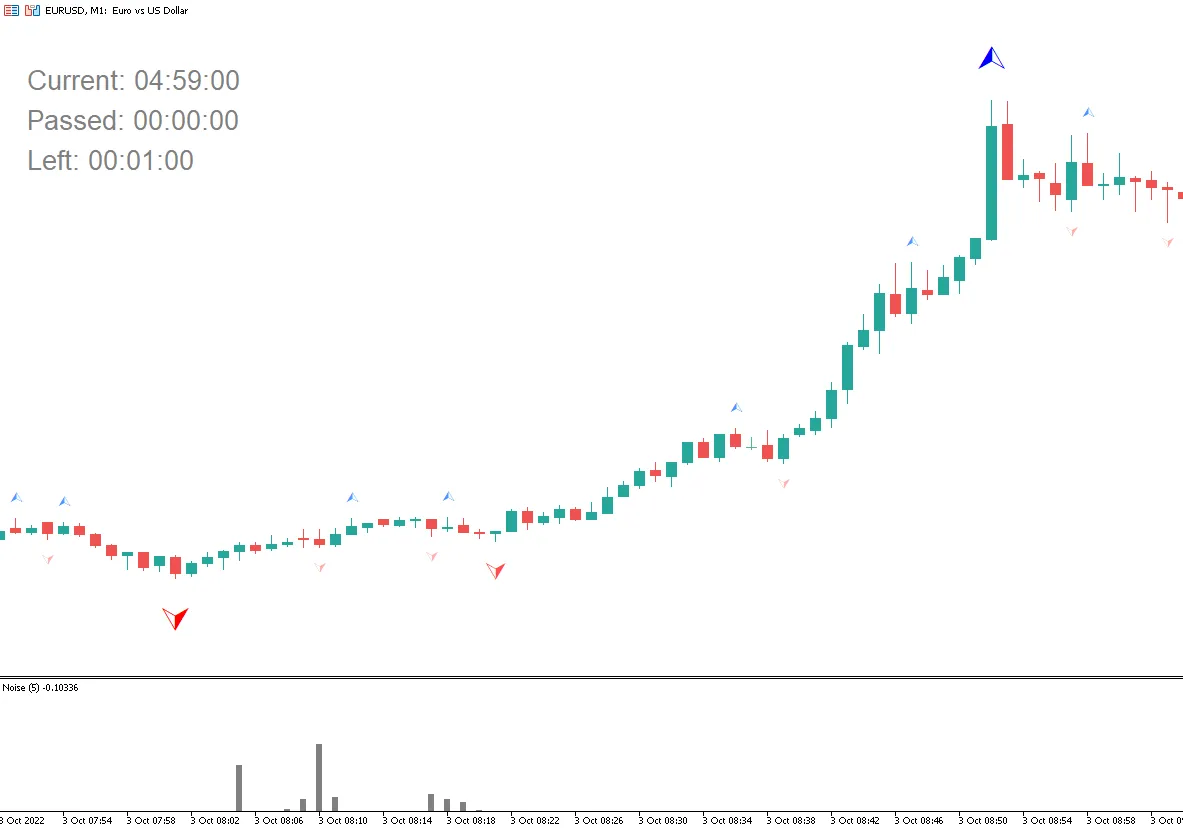
If you're looking to level up your trading game, the TimeBar indicator for MetaTrader 5 is a must-ha...
If you're diving into the world of trading with MetaTrader 5, understanding how to effectively use t...
If you're looking to enhance your trading strategy, you might want to check out this OHLC candlestic...
If you're trading with MetaTrader 5, you've probably come across OHLC candlestick charts. But have y...
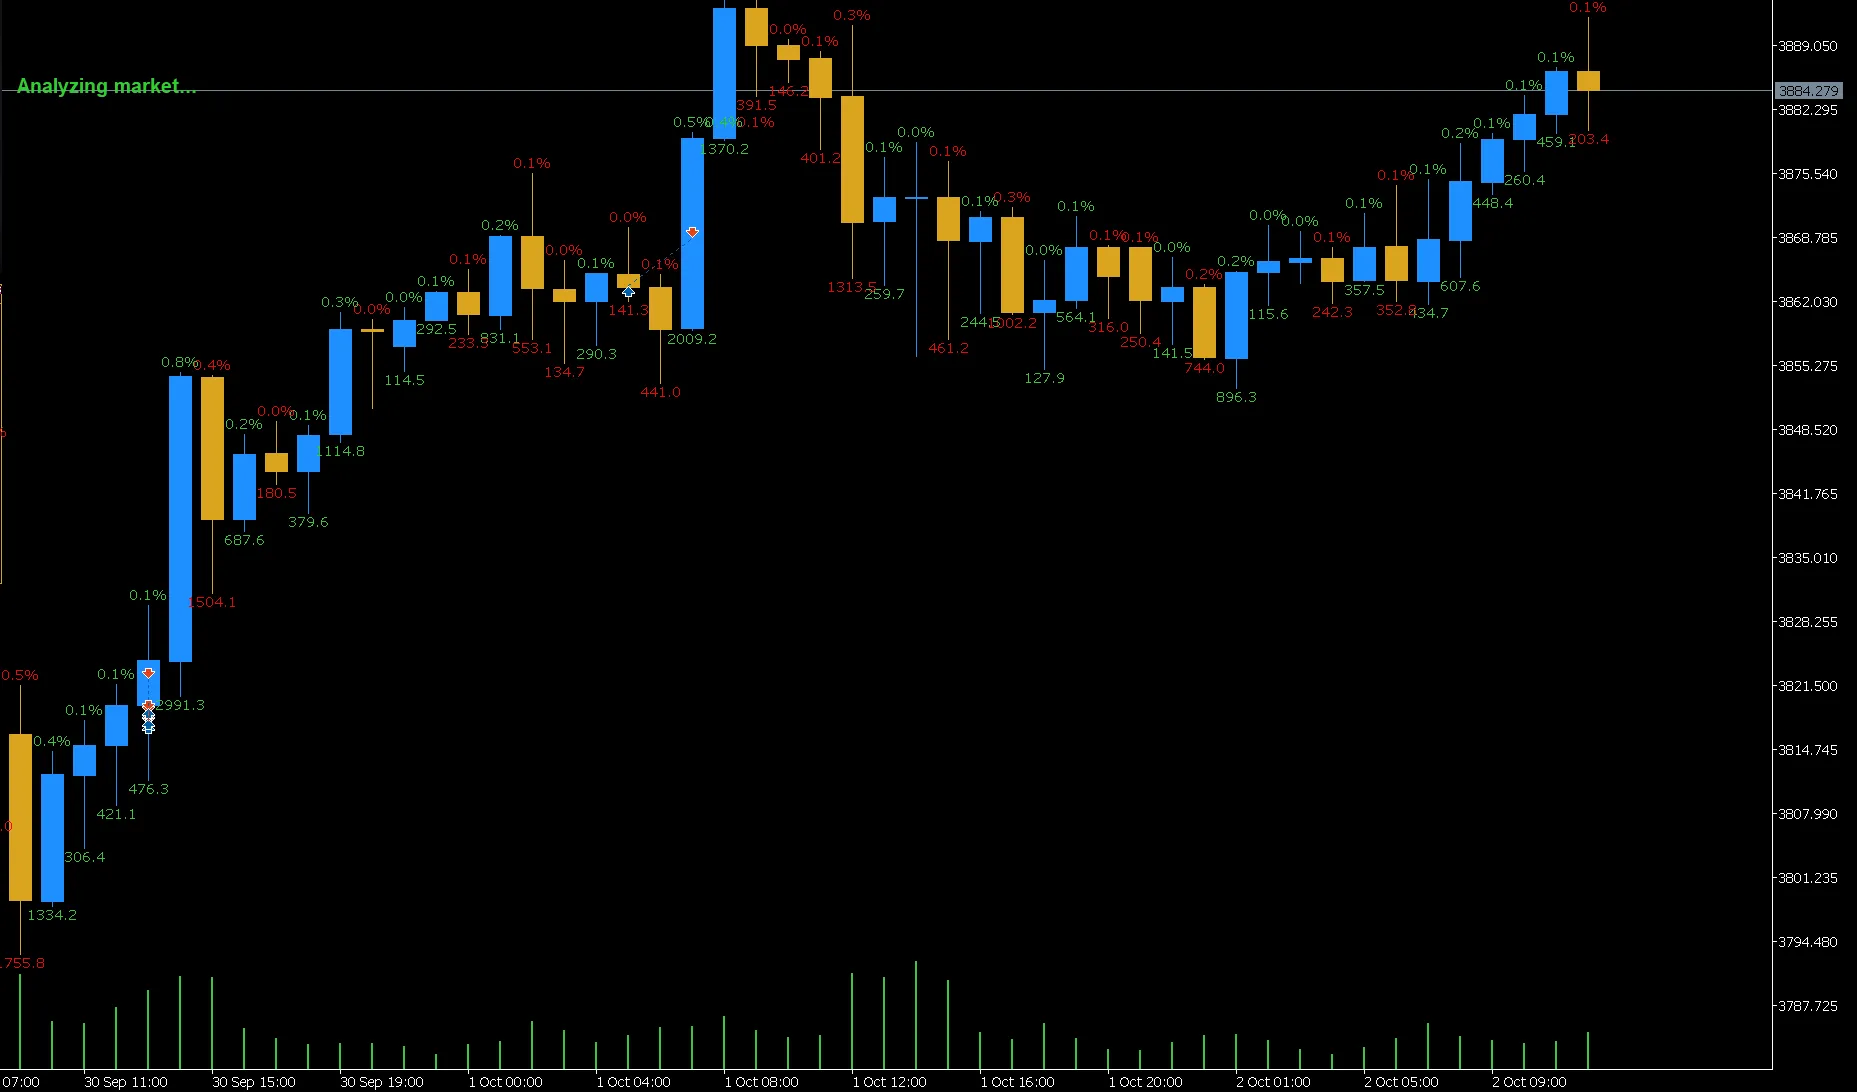
Hey traders! Today, we're diving into an exciting tool that can enhance your trading experience on M...
Key Features: Dual Display: This nifty tool automatically calculates and showcases price changes i...
If you’re diving into the world of trading, you’ve probably heard of various indicators that can hel...