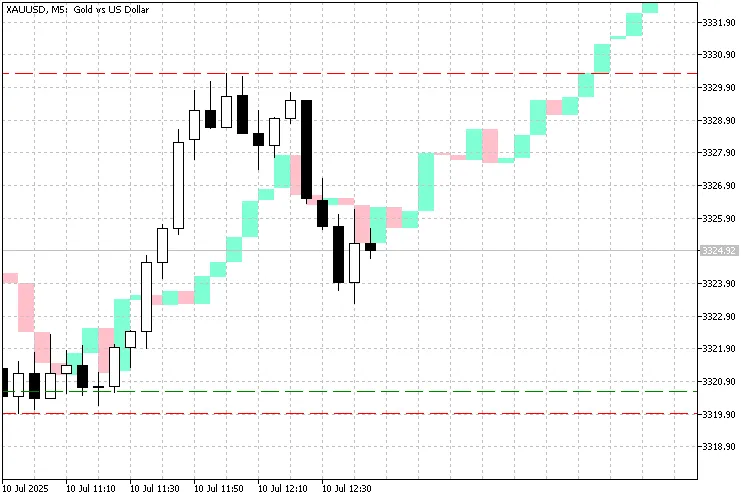
Features: Get ready to elevate your trading game with the Candle Replay Magnifier! This nifty tool a...
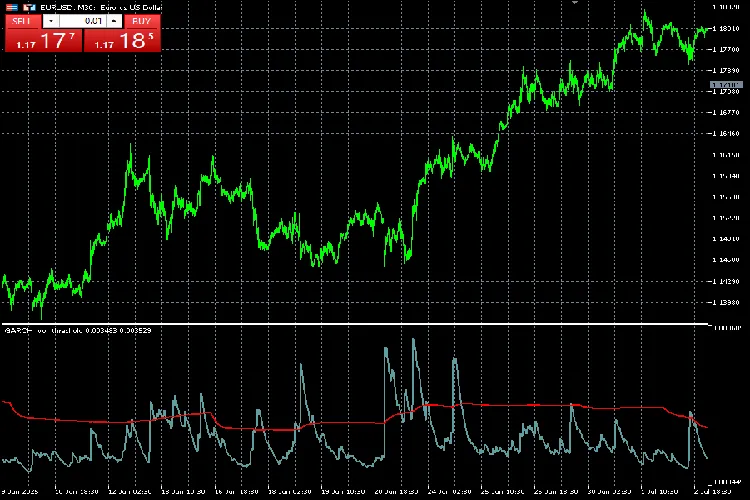
The GARCH Indicator (Generalized AutoRegressive Conditional Heteroskedasticity) is a powerful tool...
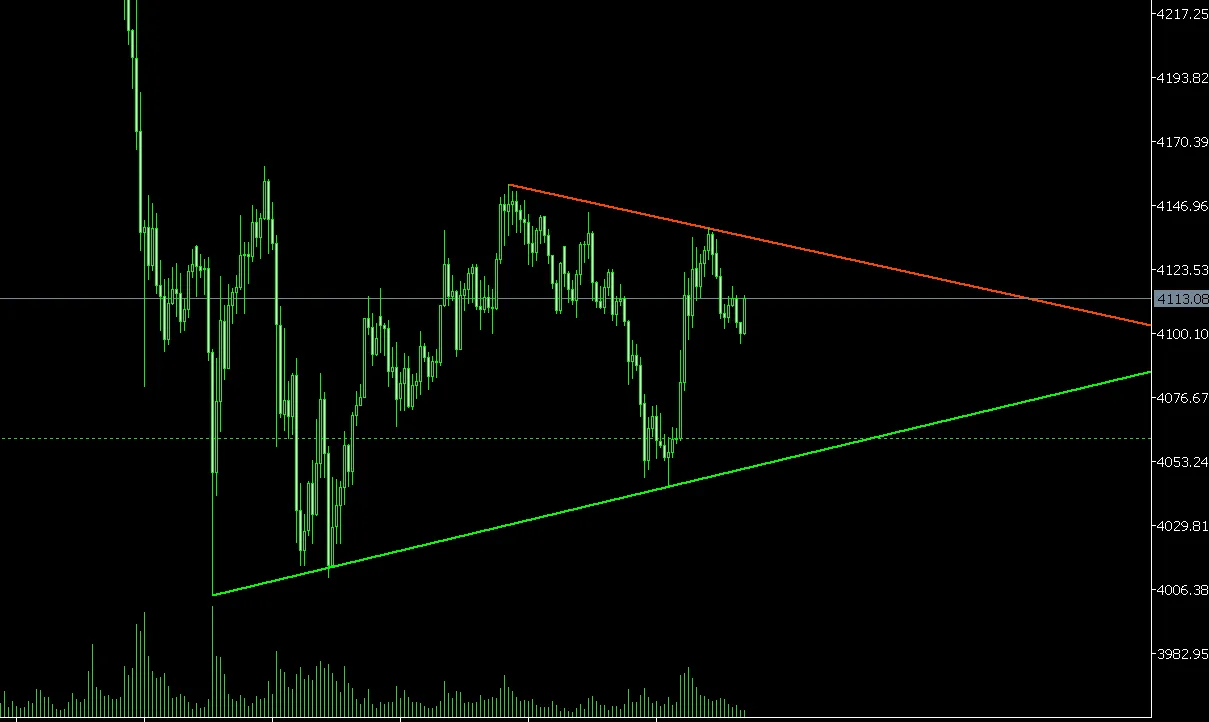
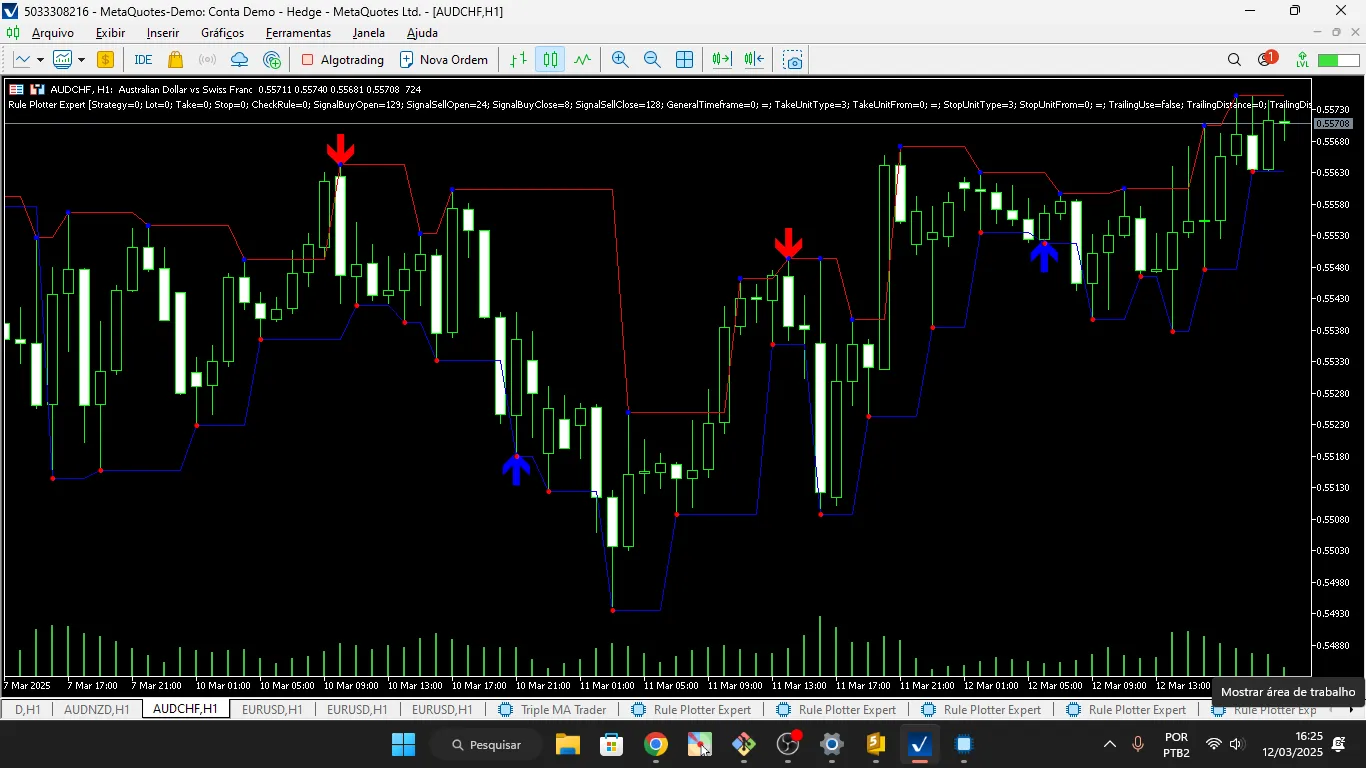
Discover the AutoTrendLines Indicator Main Features: Dual Detection Mode: Mode A: Dual Pivot Detect...
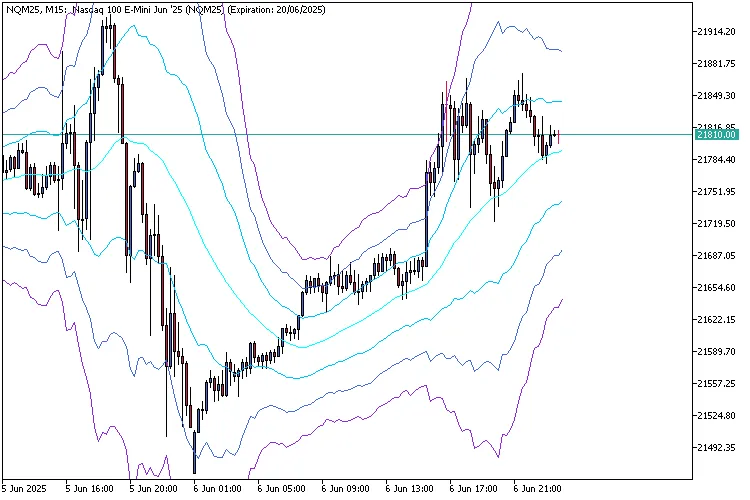
Monthly VWAP: Your Compass for Long-Term Market Direction The Monthly VWAP (Volume Weighted Average ...
Weekly VWAP: Your Go-To Tool for Weekly Market Insights The Weekly VWAP (Volume Weighted Average Pri...
Daily VWAP: Your Essential Intraday Fair Value Indicator The Daily VWAP (Volume Weighted Average Pr...
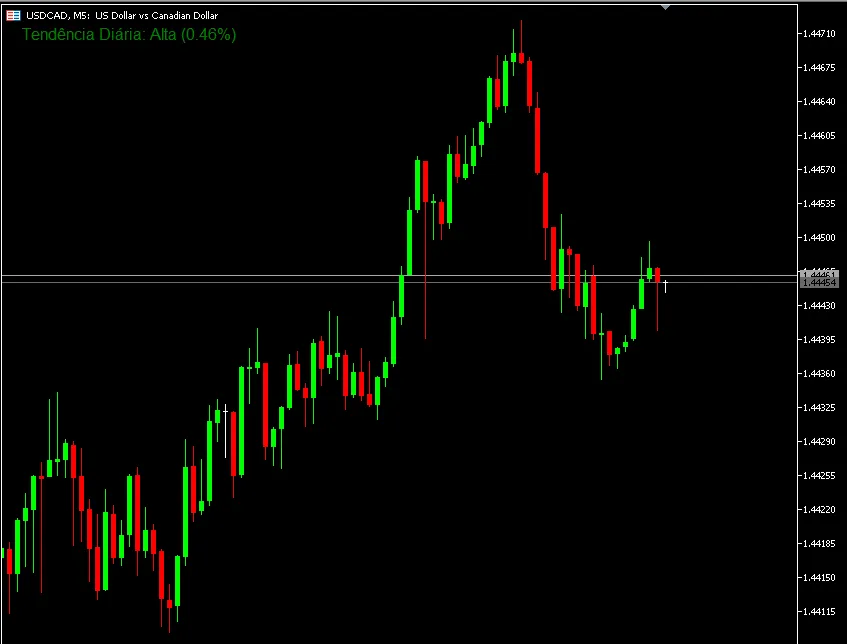
Key Features of the Watermark Indicator1. Dynamic WatermarkingAutomatically displays the current sym...
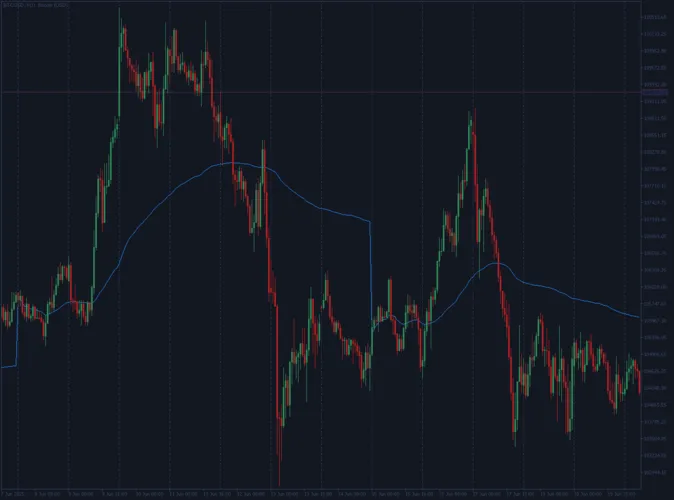
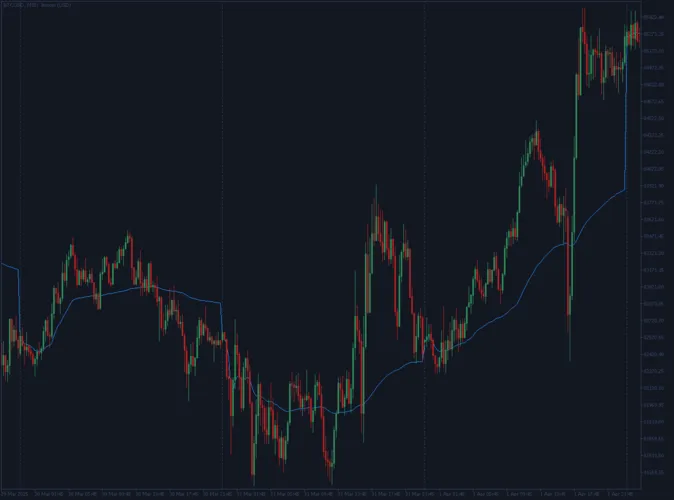
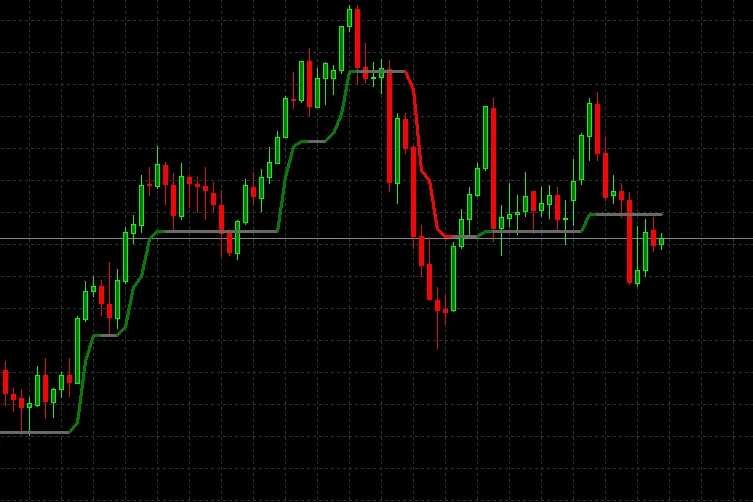
Understanding the HLPeak Trend Indicator The HLPeak Trend Indicator is a powerful tool for traders u...
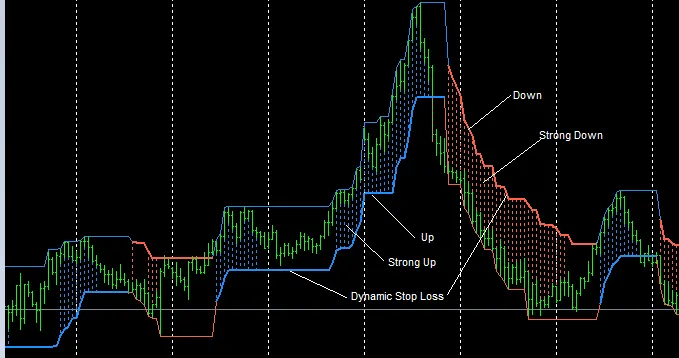
Get to Know the Trend Equilibrium Indicator (TrendEQ) If you’re looking to elevate your trading gam...
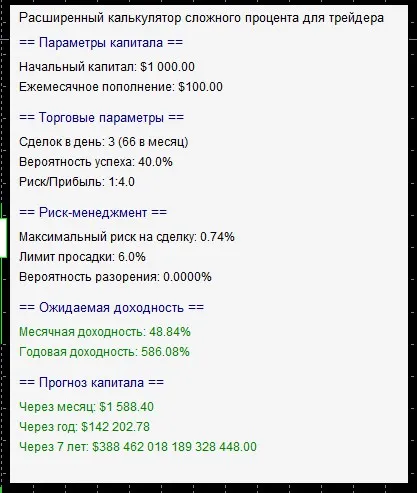
Are you looking to take your trading game to the next level? Our advanced compound interest calculat...
What's New in Version 1.04? In the latest update, version 1.04, we’ve introduced cursor synchron...
Candle Size Indicator Overview Main Features of the Indicator Candle Size Calculation: This ind...
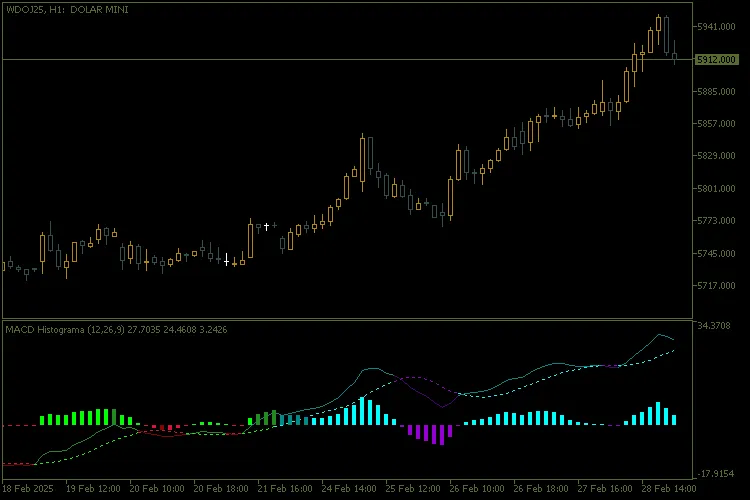
Key Features Dynamic and Coloured Histogram:The histogram automatically chang...
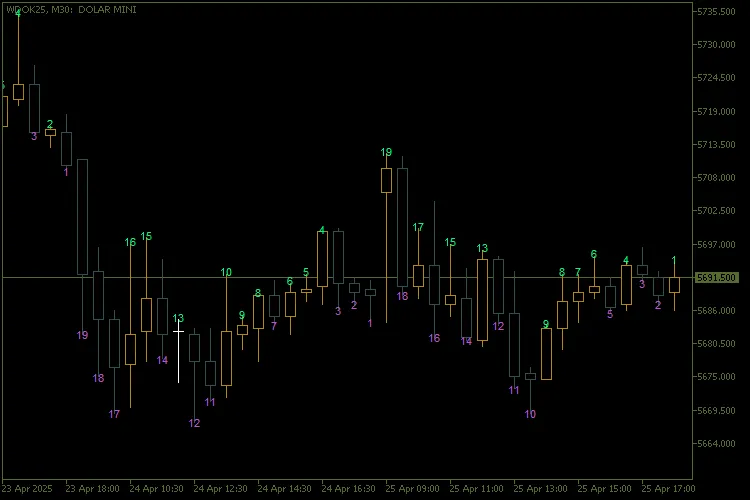
Unlock the Power of the Candle Counter Hey there, fellow traders! If you're looking to enhance your ...
Features: Compatible with all trading symbols. This indicator is multi-timeframe, giving you flexib...
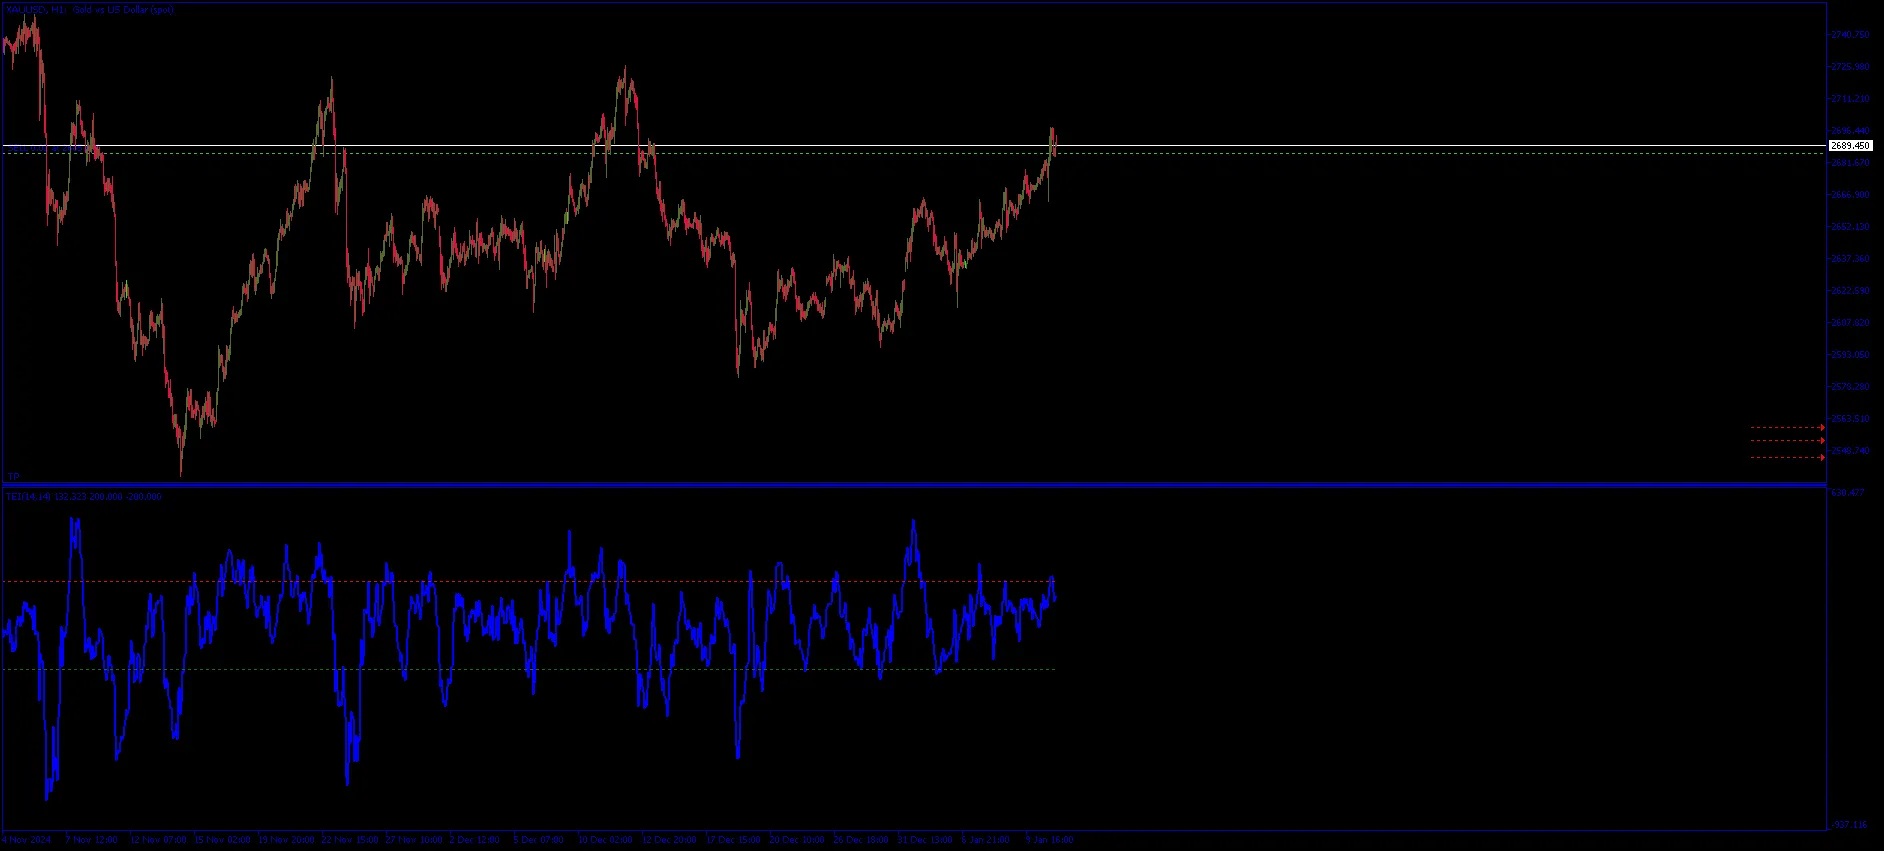
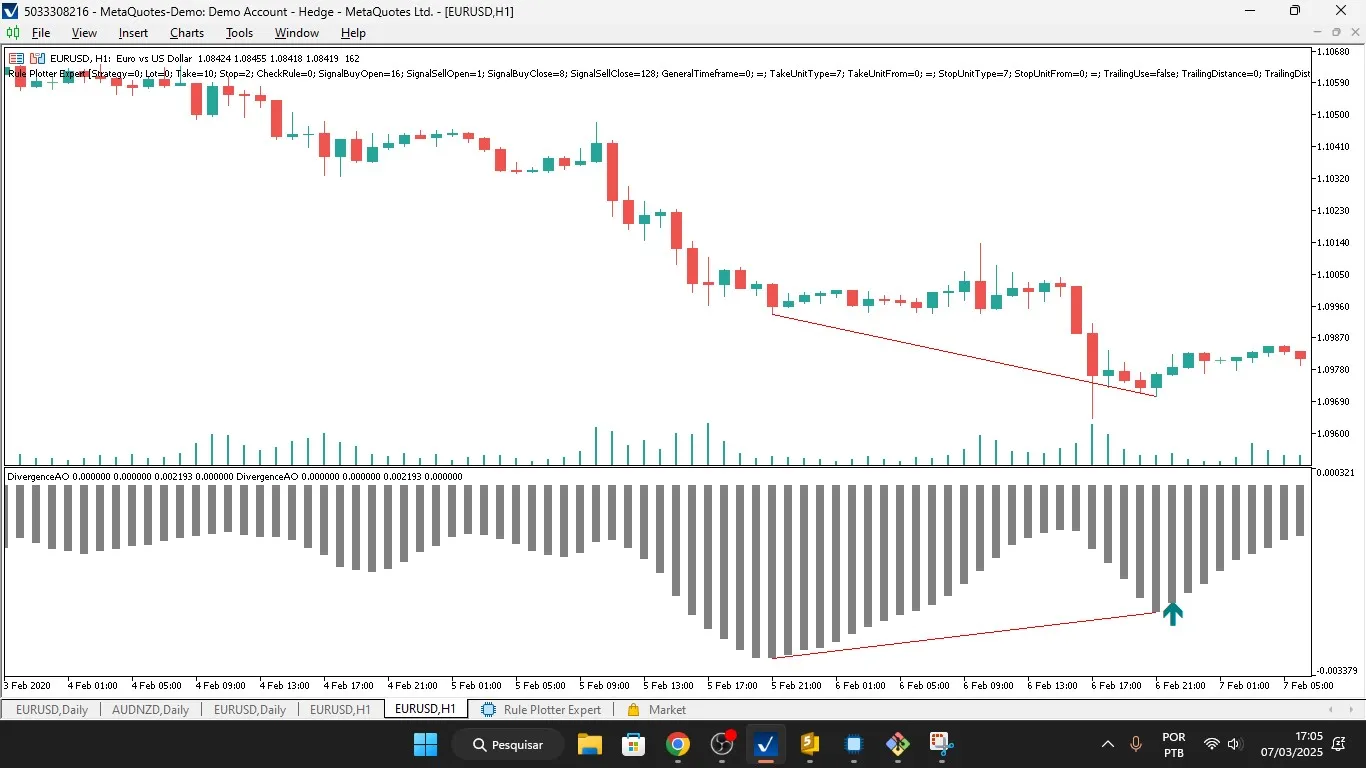
If you’re looking to up your trading game, the Divergence Awesome Oscillator might just be the tool ...
Unlock the Power of Trend Analysis Hey fellow traders! If you’re looking to enhance your trading gam...
Hey fellow traders! Today, I want to talk about a powerful tool you can add to your trading arsenal:...
View AlphaTrend Indicator If you're looking to sharpen your trading game, the AlphaTrend Indicator f...
Understanding the "False Breakouts" Indicator for MetaTrader 5 Overview The False Breakouts indic...