Have you ever found yourself confused by abbreviated symbol names on your trading charts? Well, worr...
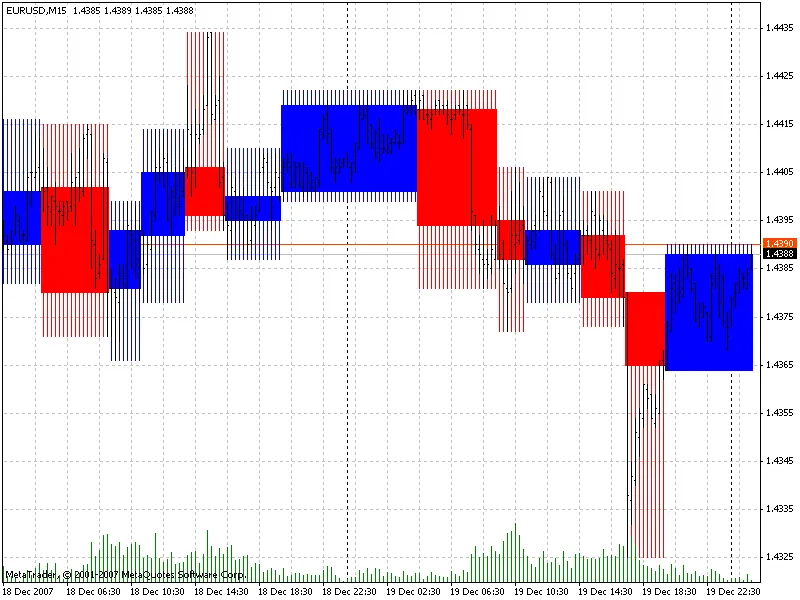
Hey there, fellow traders! Today, let’s dive into the world of quasi-volume bars and how they can e...
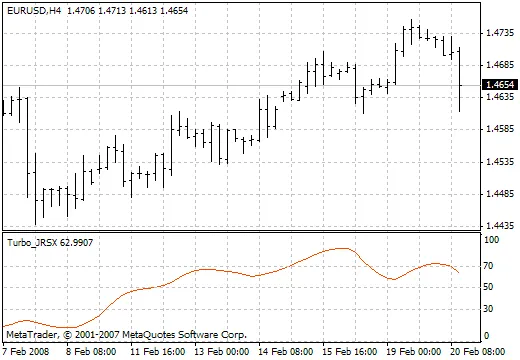
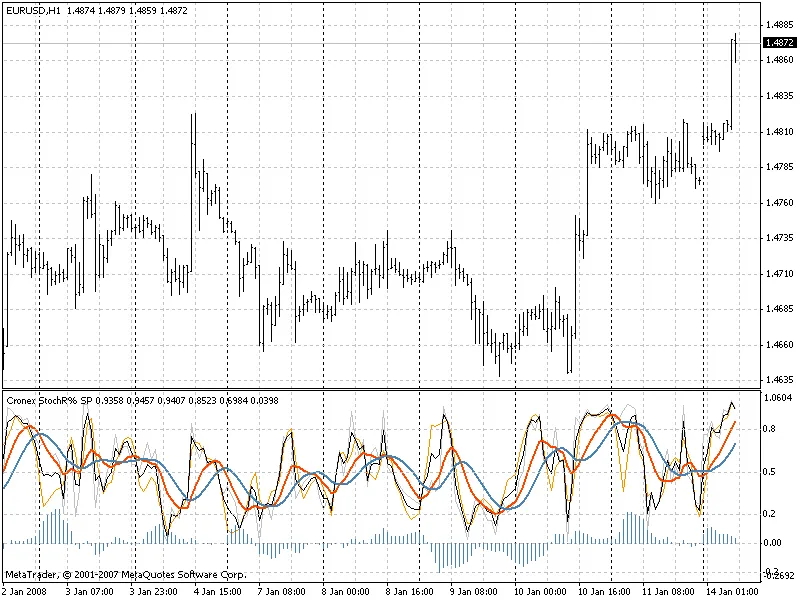
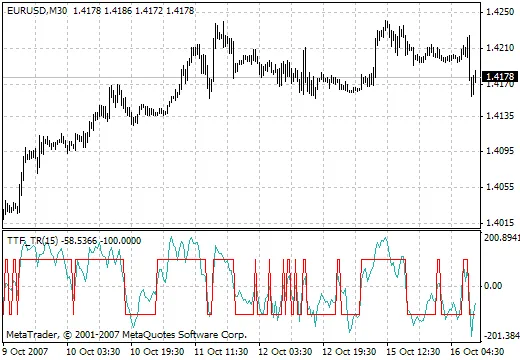
Author: fingerIf you’re looking to enhance your trading strategy, the Turbo JRSX indicator might jus...
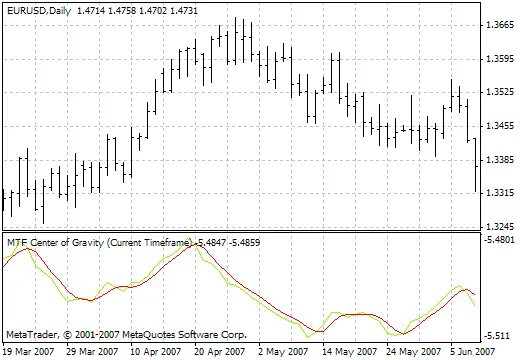
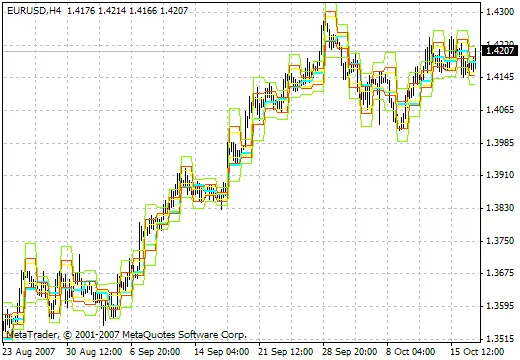
Understanding the MTF Center of Gravity Indicator The MTF (Multi-Time Frame) Center of Gravity indic...
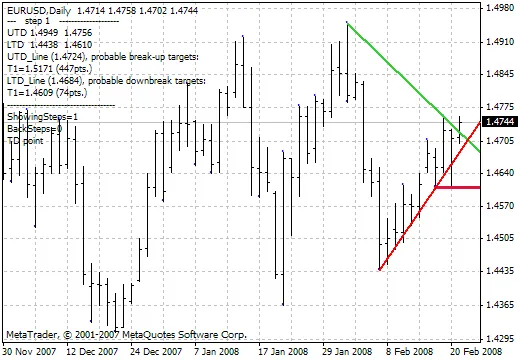
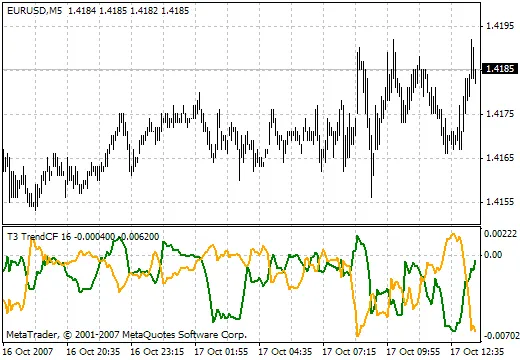
Author: Kara Software Corp Are you looking to enhance your trading strategy? The DeMark Trendline Tr...
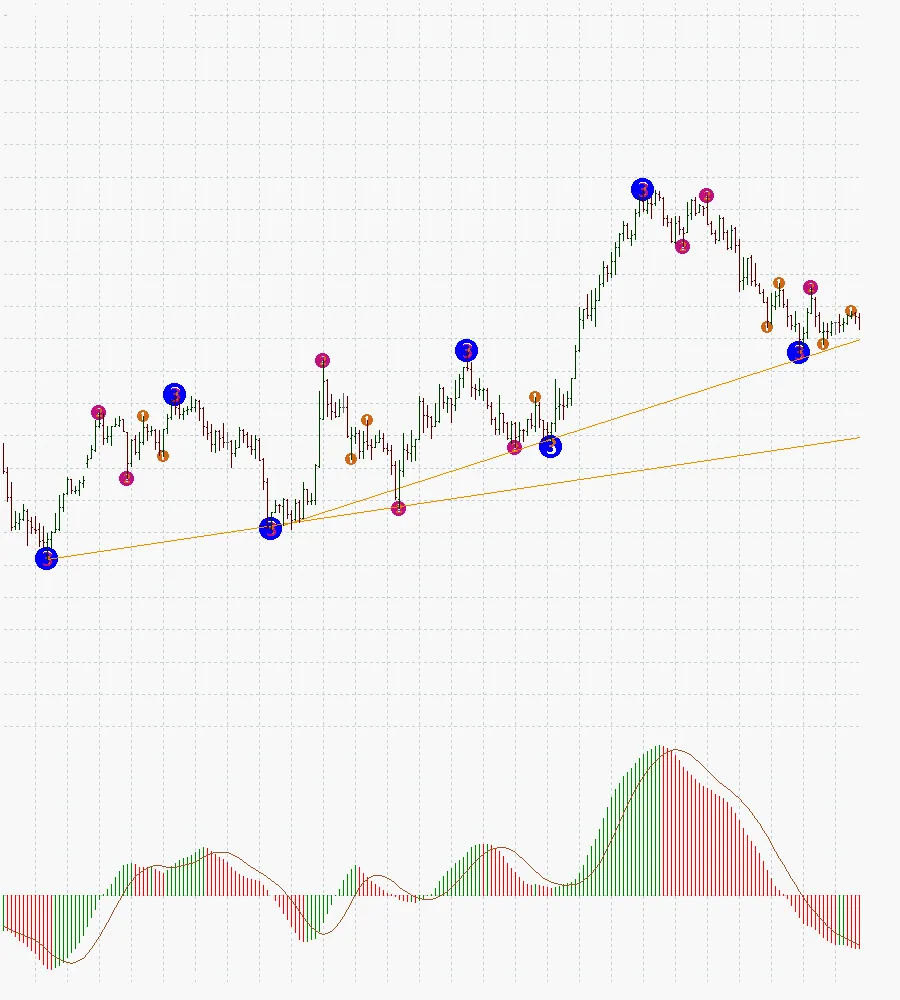
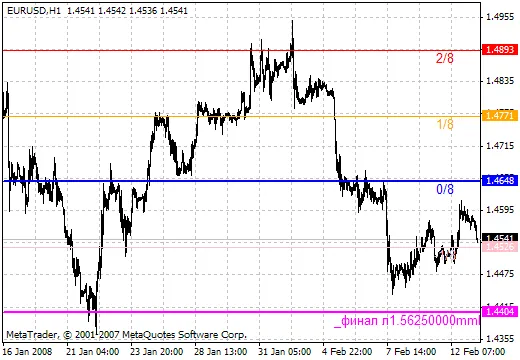
If you're looking to elevate your trading game, the 3-Level ZZ Semafor indicator might just be what ...
Switching between different periods and indicator parameters can often feel like a time-consuming ta...
Understanding the Impulse MACD Indicator The Impulse MACD is built on a system that combines three k...
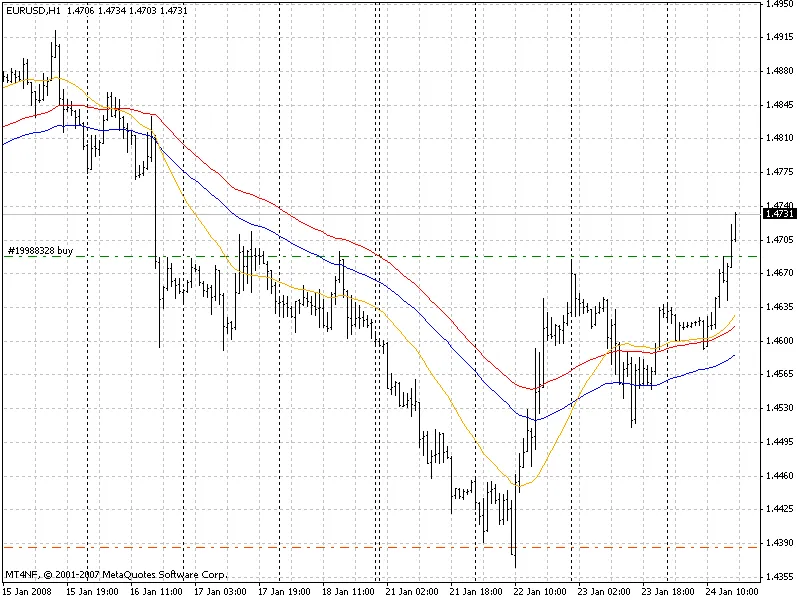
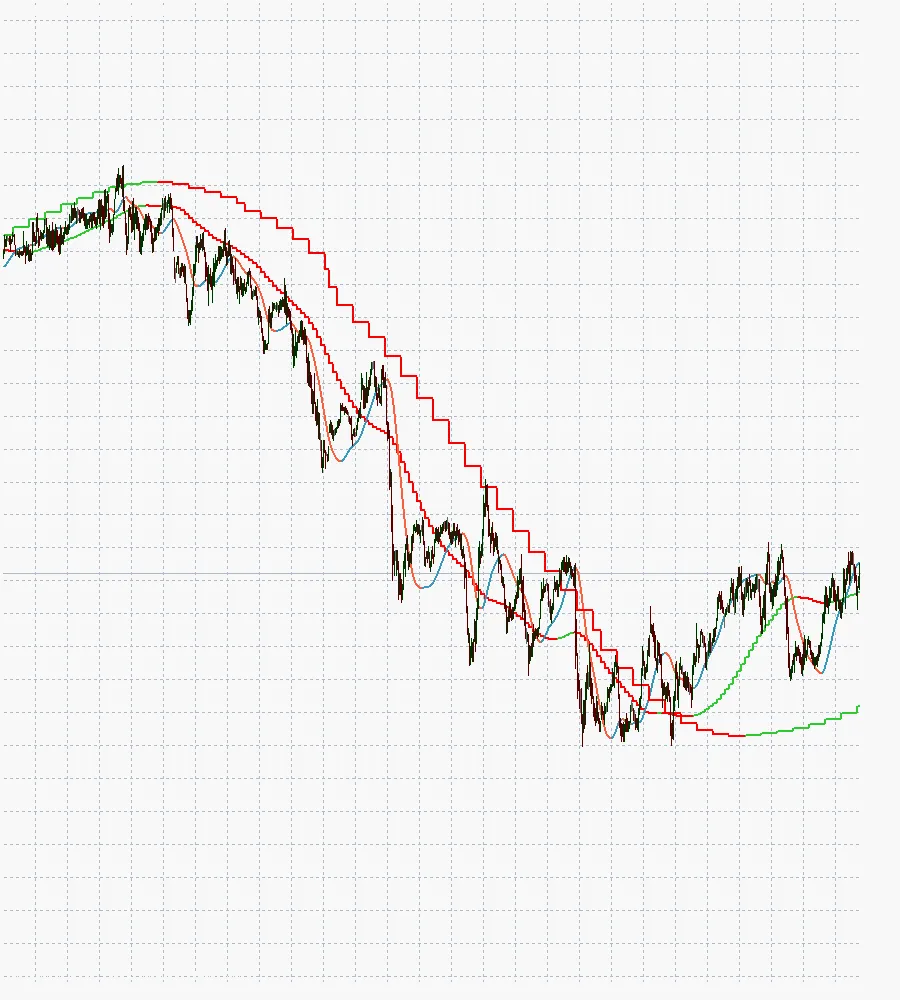
If you're looking to enhance your trading toolkit, the SlopeDirection_MTF indicator is a fantastic a...
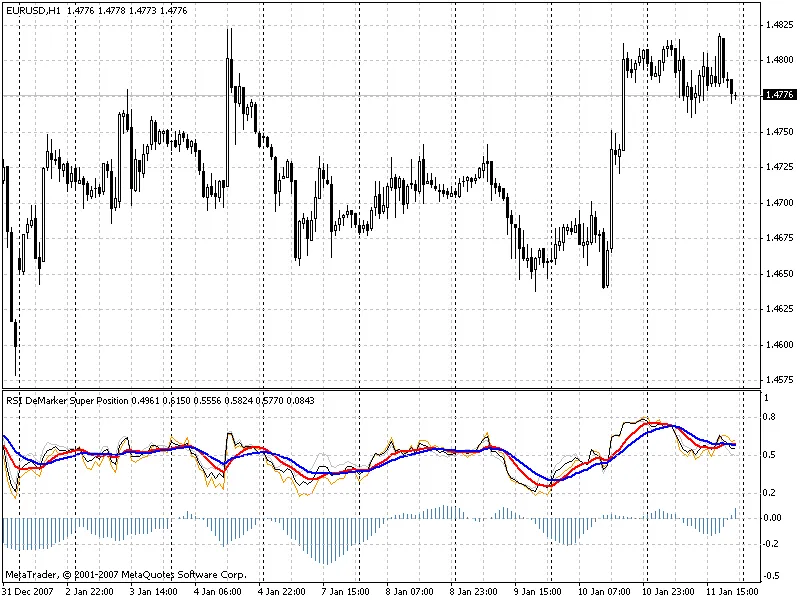
Welcome back, fellow traders! Today, I’m excited to dive into another gem from the Super Positions s...
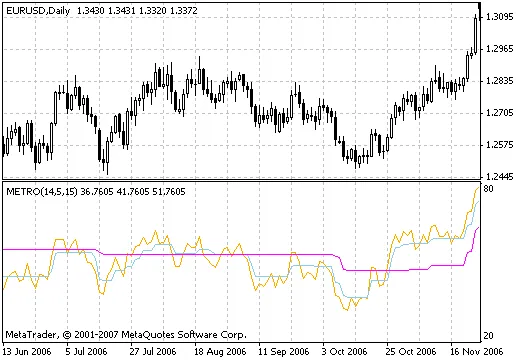
The Metro Indicator Explained Hey there, fellow traders! Today, we’re diving into the Metro indicato...
Hey fellow traders! Today, let's dive into a powerful tool that can help sharpen your trading strate...
Hey fellow traders! Today, let’s dive into a nifty tool that can help sharpen your trading edge—the ...
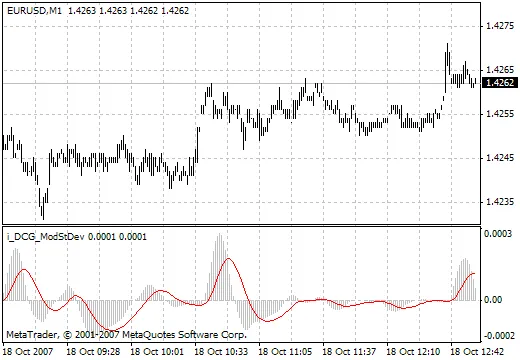
Author: Fermin Da Costa Gomez Today, let’s dive into the iDCG ModStDev indicator and see how it can ...
Hey fellow traders! Today, I want to dive into a handy tool that can give your trading strategy an e...
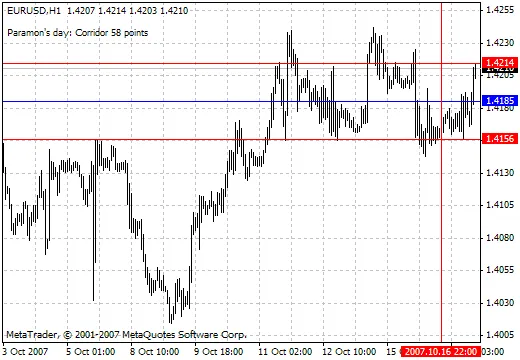
Hey fellow traders! Today, I want to share something that could become your new best friend in the F...
Author: Ronald Verwer / ROVERCOM Welcome back, fellow traders! Today, we're diving into the world of...
Author: DanillaWhat is the Par Test Indicator?The Par Test indicator is a handy tool for traders aim...
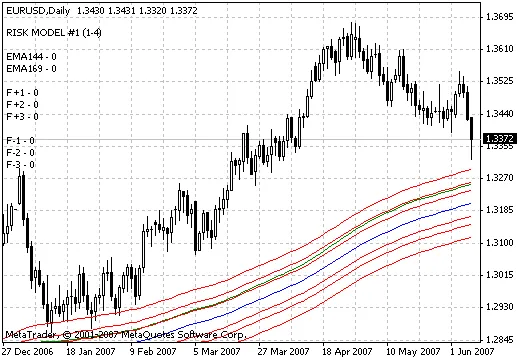
Author: Fermin Da Costa Gomez Are you looking to refine your trading strategies? Let’s dive into the...
Hey fellow traders! Today, we're diving into the Trendscalpindic indicator, a powerful tool for anyo...