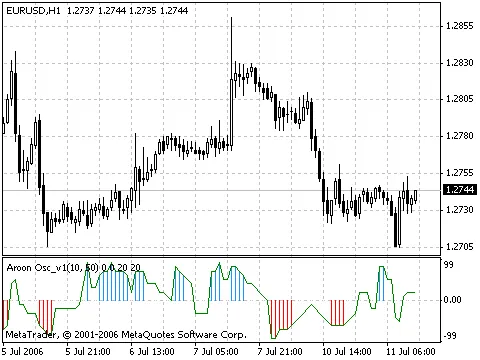
Understanding the Aroon OscillatorThe Aroon Oscillator is a powerful tool for traders, helping us qu...
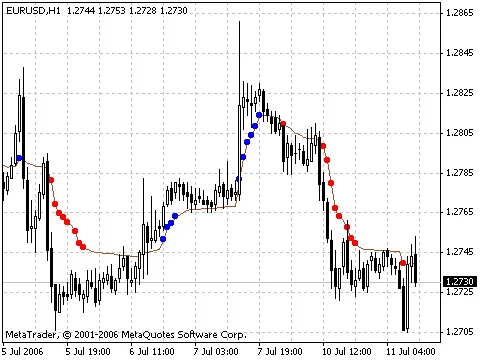
What is an Adaptive Moving Average? The Adaptive Moving Average (AMA) is a powerful tool that many t...
Hey traders! If you're on the lookout for a reliable tool to help you spot trend reversals, you migh...
The Aroon Indicator is a fantastic tool for traders looking to gauge market trends. When the Up Line...
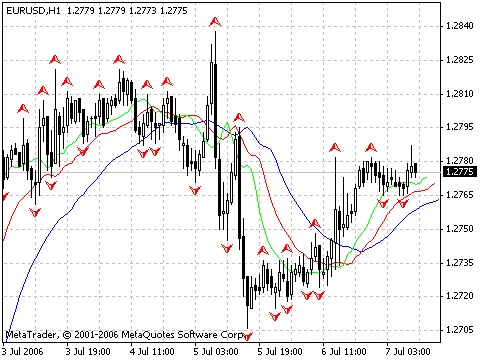
Welcome back, fellow traders! Today, we're diving into the latest version of ShadeNY—version 5. This...
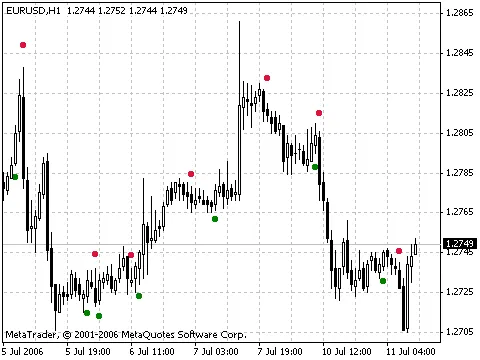
The Coffie v1 indicator can be a game changer for your trading strategy by providing clear ente...
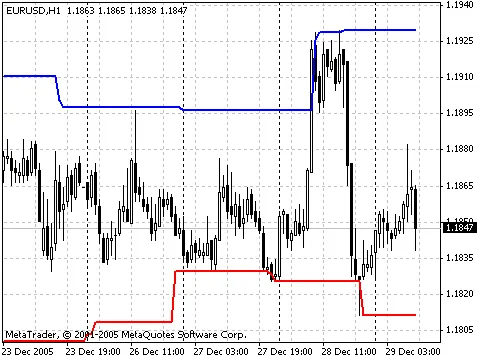
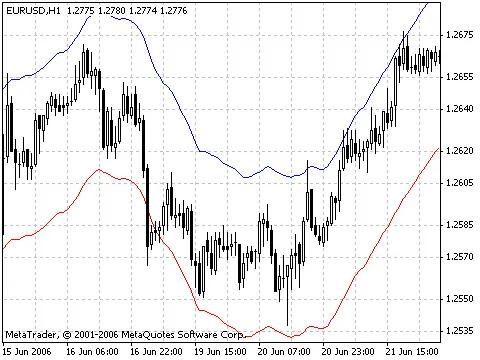
The Price Channel indicator is a handy tool for traders looking to gauge market trends. It calculate...
Hey fellow traders! Have you ever wished for a little nudge when it's time to buy or sell? Well, the...
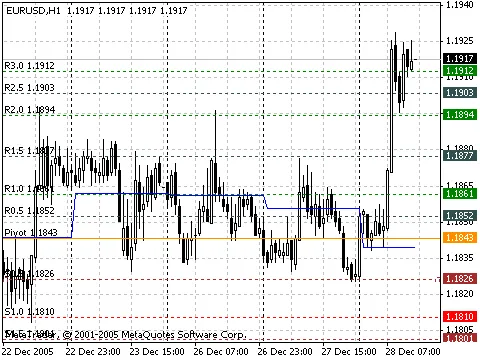
If you're looking to stay ahead of the game in trading, the Daily Pivot Points indicator is a tool y...
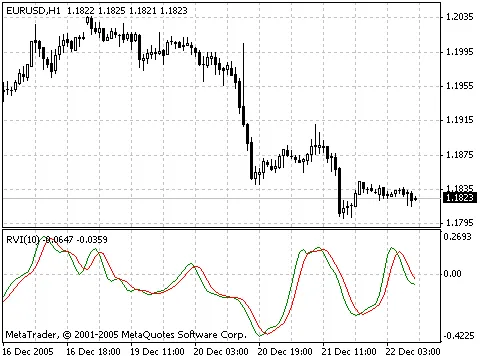
Hey there, fellow traders! Today, we’re diving into the ins and outs of the Relative Vigor Index (RV...
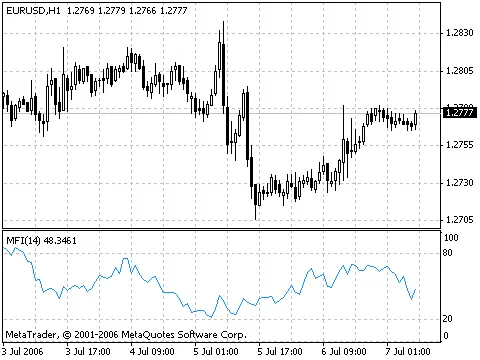
The Money Flow Index (MFI) is a powerful tool that helps traders gauge the pace at which money is fl...
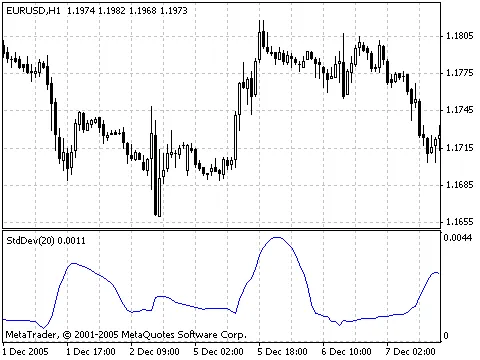
The Standard Deviation Indicator (often referred to as StdDev) is a key tool for measuring market vo...
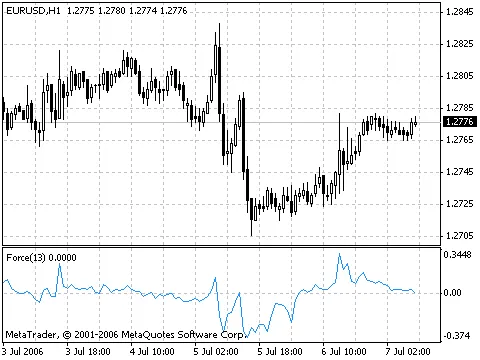
Hey fellow traders! Today, let’s dive into the Force Index (FRC) indicator, a fantastic tool that me...
If you're looking to sharpen your trading skills, then getting to know the Williams Percent Range (%...
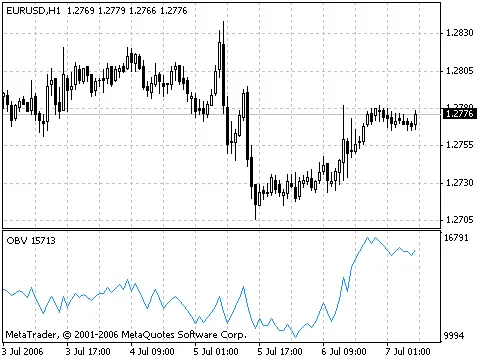
Hey there, fellow traders! Today, let’s dive into the On Balance Volume (OBV) indicator, a handy too...
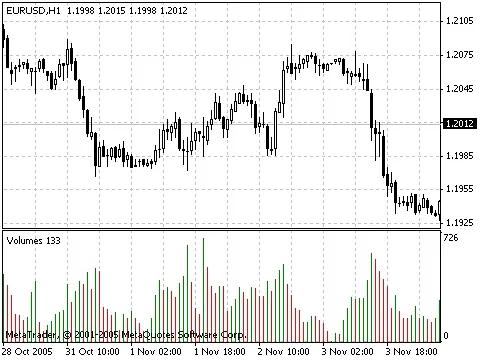
If you're diving into the world of trading, one tool you shouldn't overlook is the Volume Indicator....
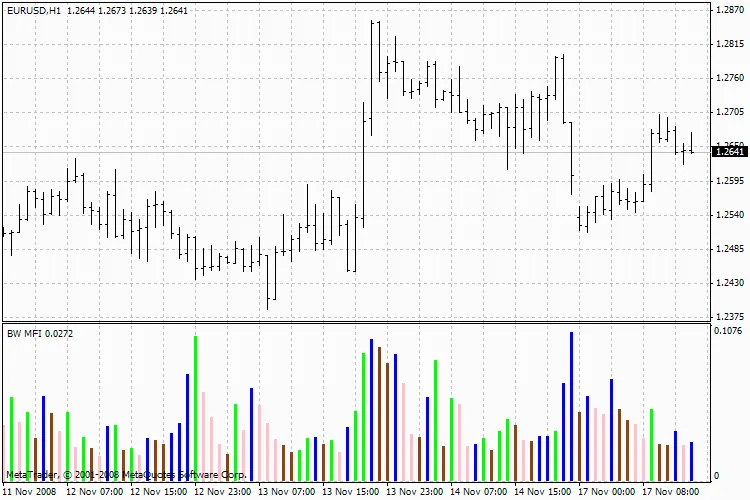
The Market Facilitation Index (BW MFI) is a unique technical indicator that helps us understand pric...
The Gator Oscillator is a powerful trading tool derived from the Alligator indicator. It helps trade...
In the trading world, one thing's for sure: prices tend to stay pretty stable most of the time. It's...
Hey traders! Today, let’s dive into the Envelopes technical indicator, a tool that can be a game-cha...