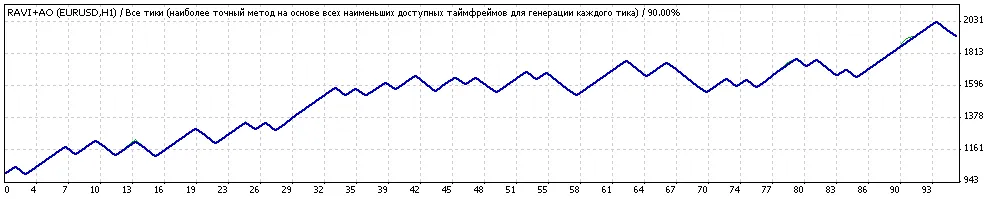
Hey fellow traders, If you're looking to enhance your trading game, let me introduce you to the Ravi...
Description: Buying Rules: 1. Ensure the fast moving average (MA) is above the slow MA....
Introducing the OSF 1.0 Expert Advisor Hey fellow traders! Let's dive into the world of open-source ...
Understanding the MA2CCI Trading System If you're on the lookout for a solid trading strategy, let m...
Discover the Power of Up3x1 Investor EA The Up3x1 Investor is a trading system designed to capitaliz...
EES Hedger Are you looking to hedge your trades effectively? With EES Hedger, you can easily take...
How to Use IsConnected with MetaTrader 4 If you're looking to enhance your trading experience on Me...
Strategy Tester Report Sidus v1 Alpari-Demo (Build 217) Symbol EURUSD (Euro vs US Dollar) Perio...
Description:The Trend RDS is an innovative trading system designed for MetaTrader 4 that helps you i...
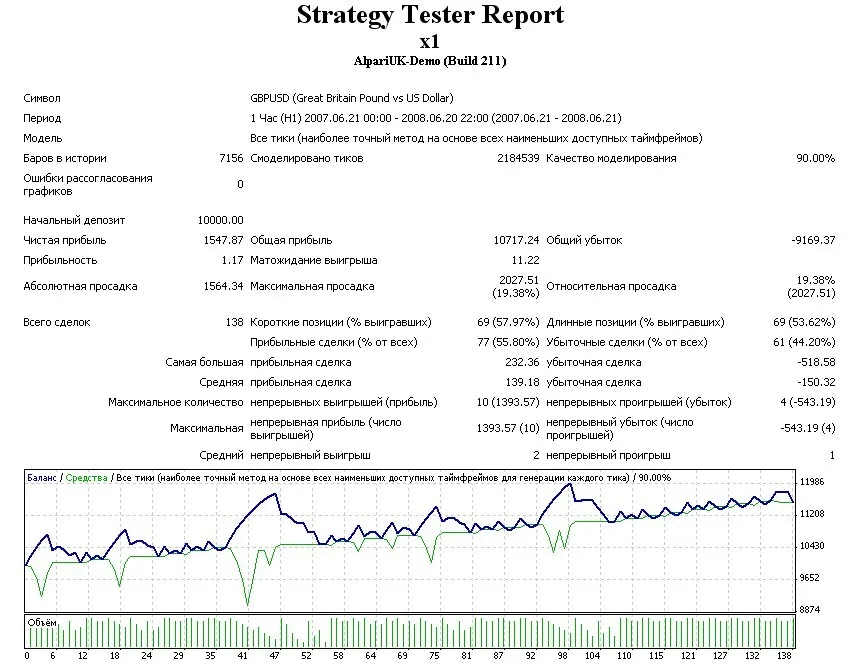
Hey fellow traders! Today, let’s dive into how the x1 EA (Expert Advisor) operates on MetaTrader 4 a...
Indicators Used: Moving Average (SMA, WMA, EMA) Understanding the Trading Strategy To get start...
If you're looking to boost your trading game, you might want to check out the Altarius RSI & Stochas...
Introducing Vector EA: Your New Trading Ally If you're on the lookout for a reliable trading assista...
Are you ready to enhance your trading game with the Natuseko Protrader 4H Strategy on MetaTrader 4? ...
Hey traders! Today, let’s dive into the latest release of the ZigAndZag V2 Expert Advisor (EA) for M...
If you're looking to enhance your trading game, you can check out the original strategy for the MACD...
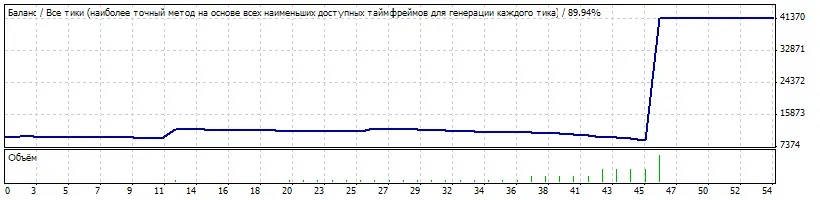
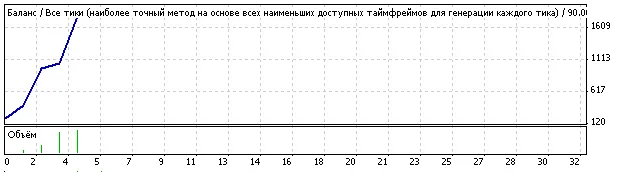
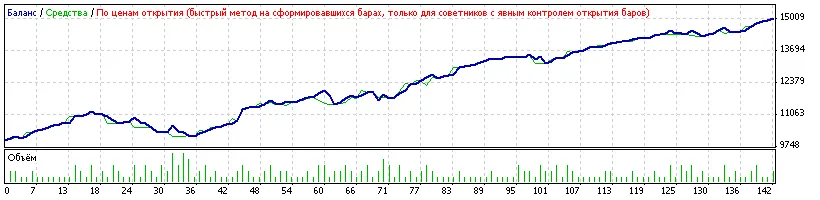
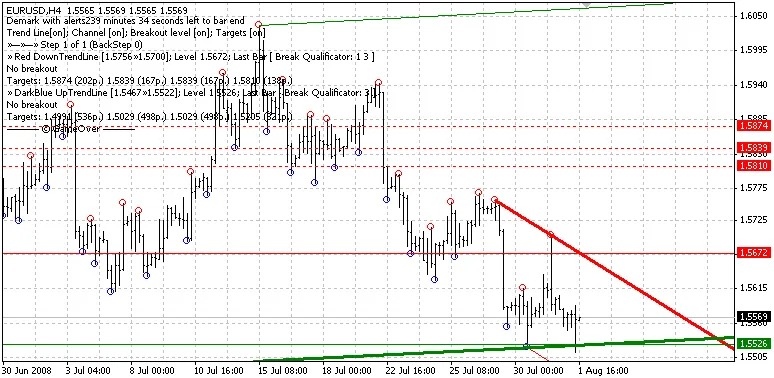
Description: Meet the DeMark Lines EA, your new trading ally that harnesses the power of the renowne...
Meet the Author Urban Sotensek A Message from Me As a seasoned Forex trader, I've been in the t...
Getting Started with Fuzzy Logic in MetaTrader 4 Hey there, fellow traders! Today, we’re diving into...
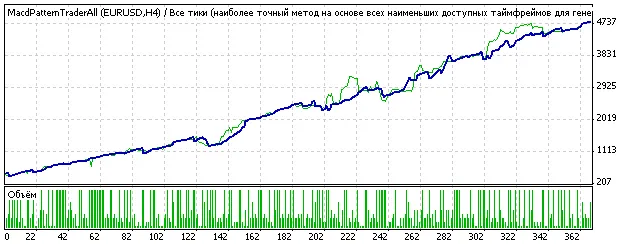
Discover the Power of MACD Pattern Trader EA If you're looking to enhance your trading strategy, the...