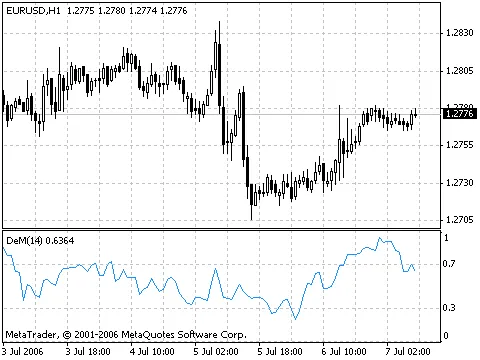
The DeMarker (DeM) indicator is a nifty tool that helps traders gauge market trends by comparing the...
The Average Directional Movement Index, or ADX, is a powerful tool for traders looking to identify ...
Latest Version: 1.4On December 24, 2005, we rolled out version 1.4 of the Period Converter, bringing...
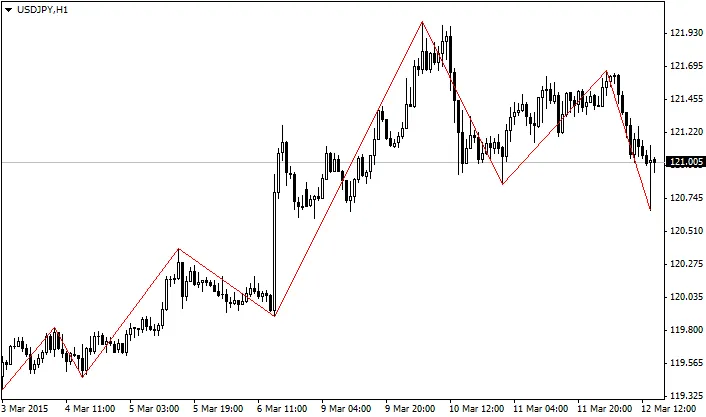
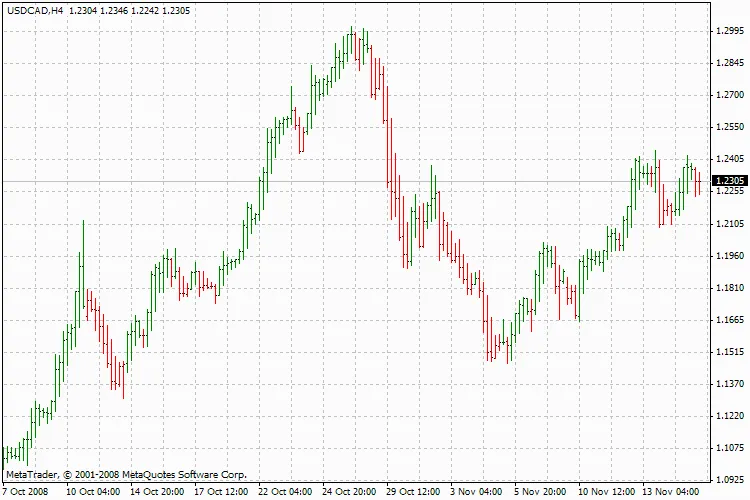
The ZigZag Indicator is a handy tool for traders, helping to track and connect the extreme points on...
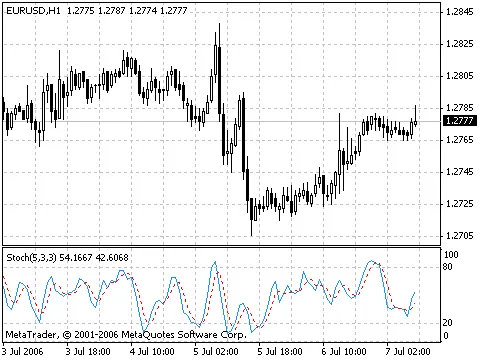
The Stochastic Oscillator is a popular technical indicator that helps traders gauge where a security...
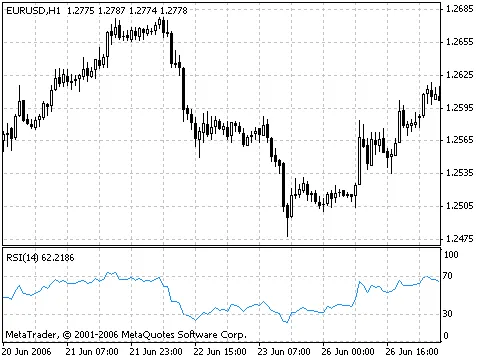
The Relative Strength Index (RSI) is a popular momentum oscillator that moves between 0 and 100, hel...
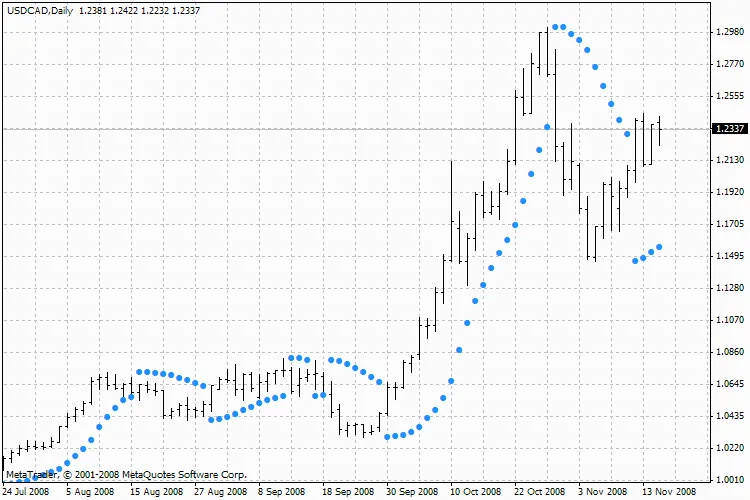
The Parabolic SAR (Stop and Reverse) is a powerful technical indicator designed for analyzing trendi...
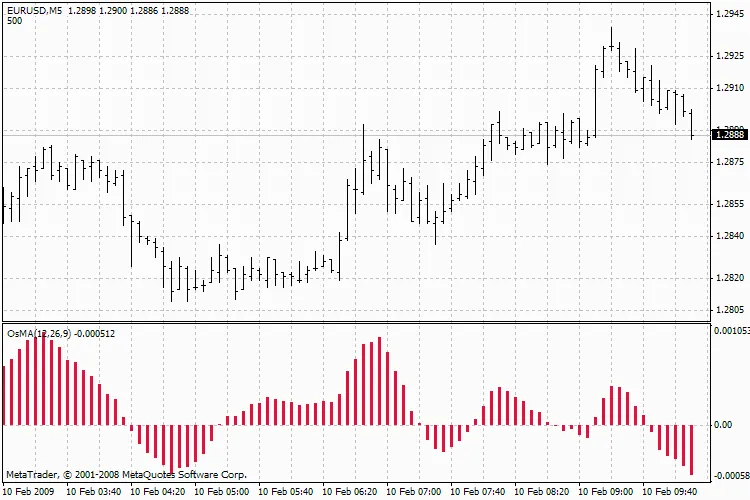
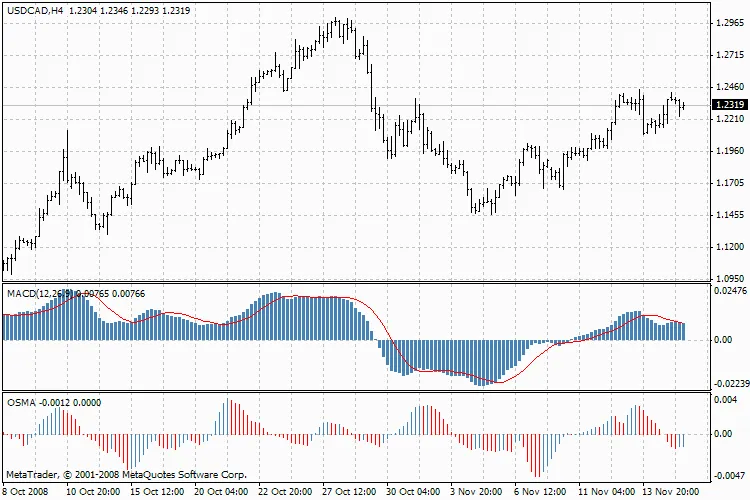
The Moving Average of Oscillator (OsMA) is a nifty tool that helps traders gauge market momentum. Es...
Hey there, fellow traders! Today, let’s dive into one of the bedrocks of technical analysis: the Mov...
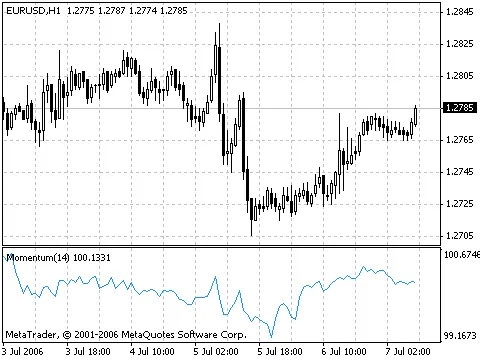
The Momentum Indicator is a powerful tool that measures how much a security's price has changed over...
The Moving Average Convergence Divergence, or MACD, is a powerful trend-following indicator that hel...
Hey there, fellow traders! Today, we're diving into the fascinating world of the Ichimoku Kinko Hyo ...
Hey there, fellow traders! Today, we're diving into the fascinating world of Heiken Ashi charts, a f...
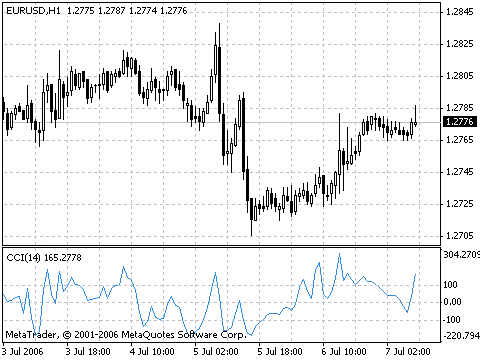
The Commodity Channel Index (CCI) is a powerful indicator that helps traders gauge how far a commodi...
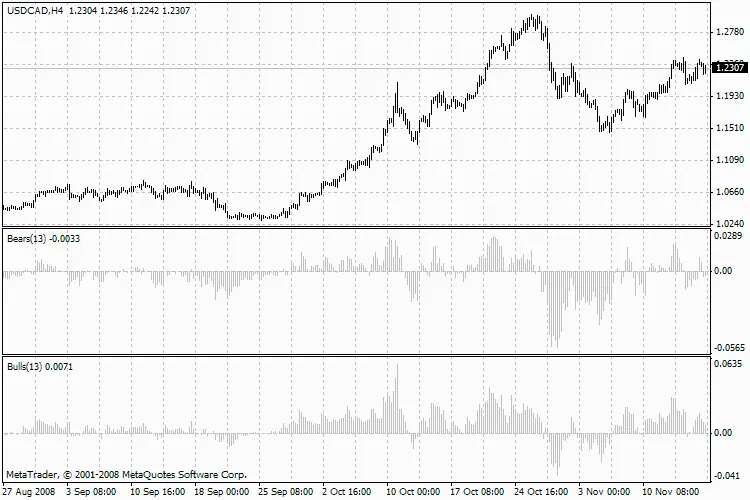
Hey there, fellow traders! Today, we're diving into the Elder-Rays technical indicator, a powerful t...
The Elder-Rays Technical Indicator is a powerful tool that blends trend-following indicators with os...
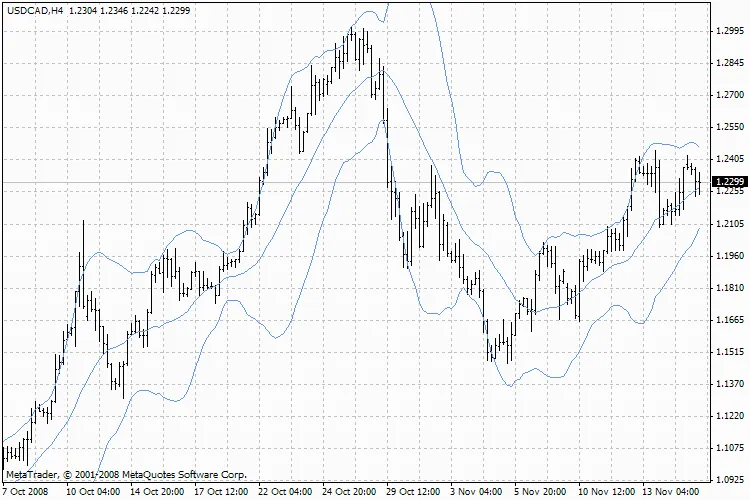
Description: Bollinger Bands, often referred to as BB, are a popular technical indicator that can re...
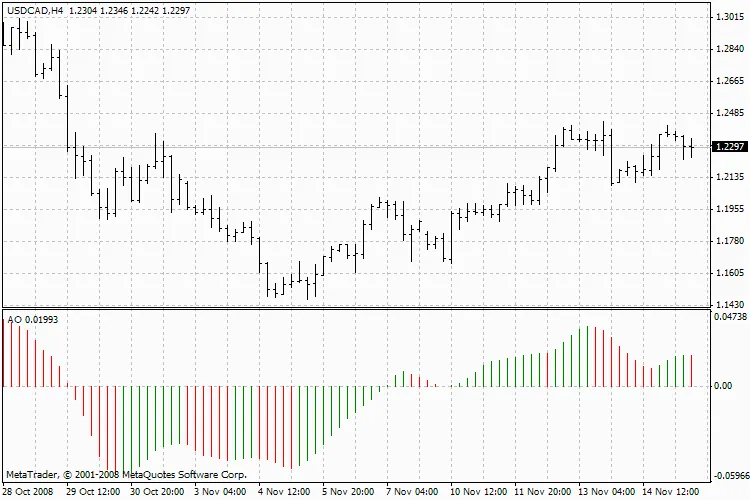
The Awesome Oscillator (AO) is a popular tool among traders, consisting of a 34-period simple Moving...
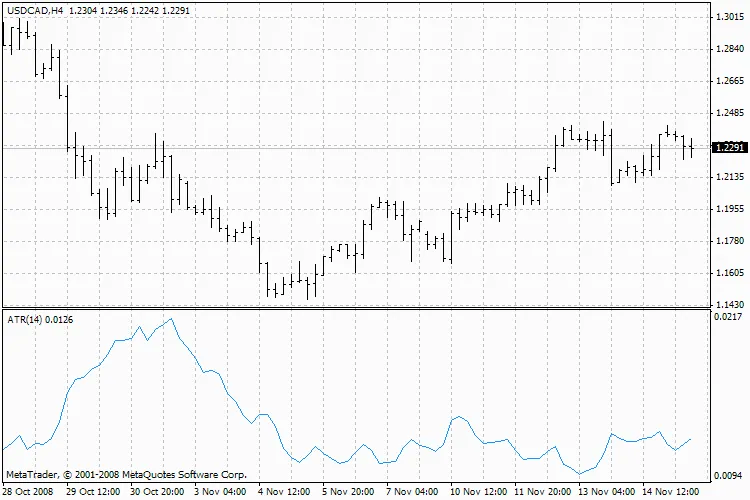
The Average True Range (ATR) is a key indicator that helps traders gauge market volatility. Develope...
The Alligator Indicator is a fascinating tool in the technical analysis arsenal, blending balance li...