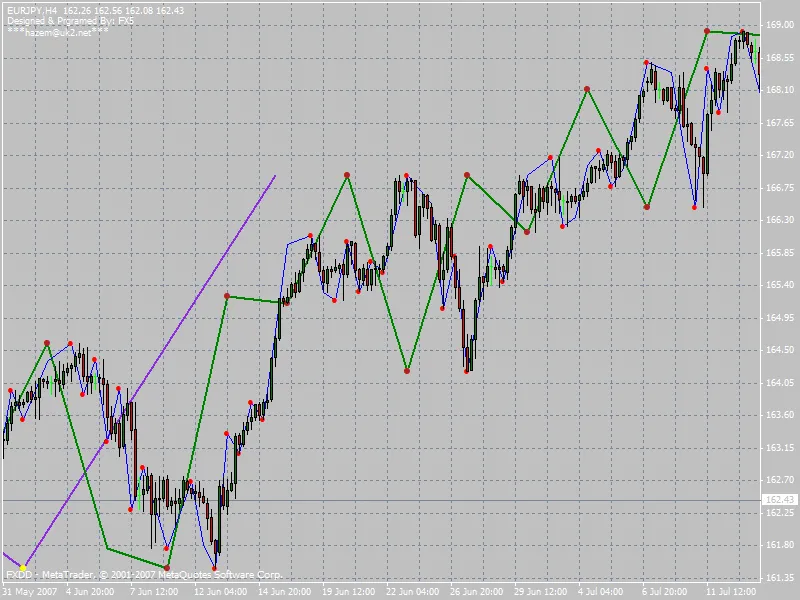
Hey there, fellow traders! If you’ve been delving into Elliott Wave theory, you might want to check ...
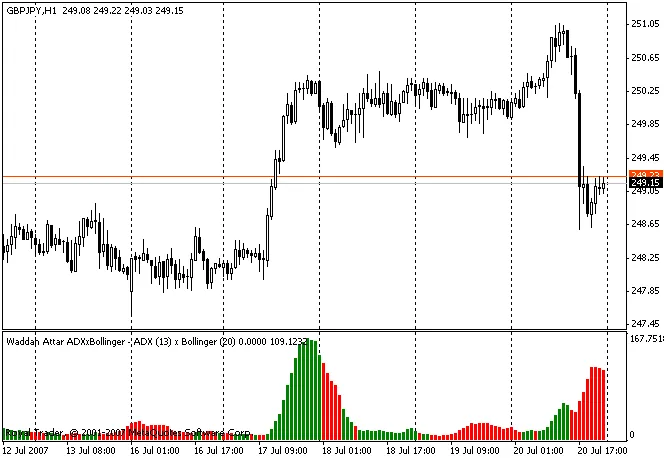
If you're looking for a powerful yet easy-to-use trading indicator, the Waddah Attar ADX and Bolling...
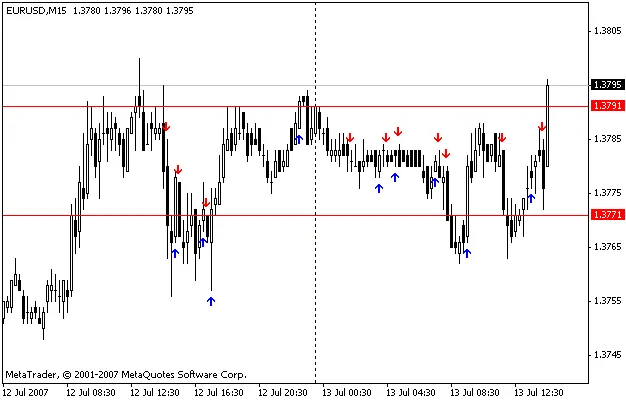
Hey fellow traders! Today, I'm excited to introduce you to my first trading indicator, the FXA0 - RS...
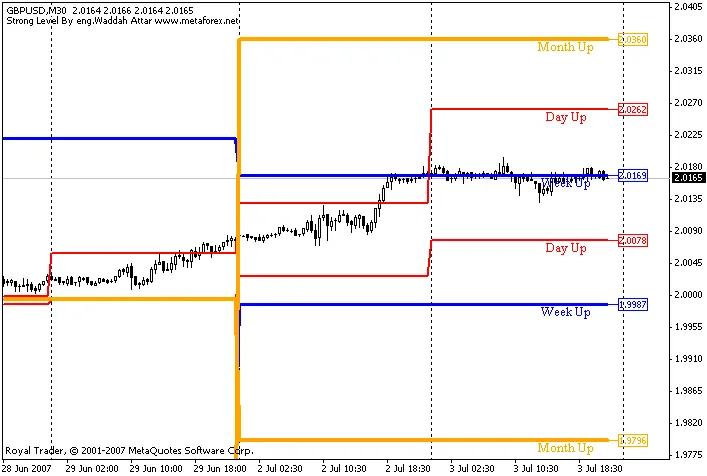
If you're looking to elevate your trading game, the Waddah Attar Strong Level Indicator is a tool yo...
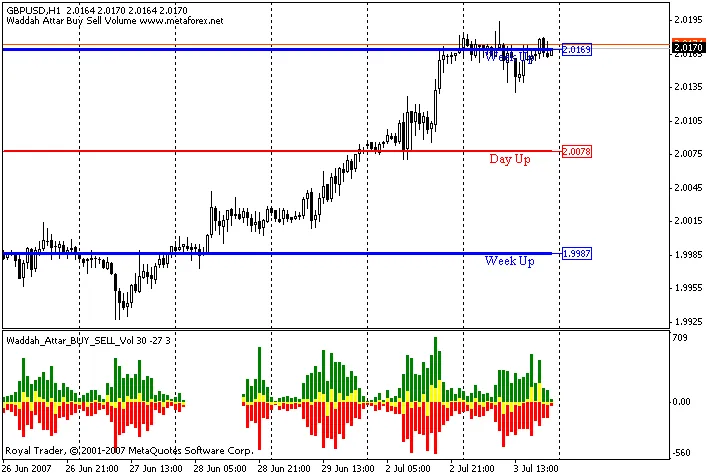
If you're a trader looking to get a better grip on market dynamics, you're in for a treat with the W...
In the February edition of Technical Analysis of STOCKS & COMMODITIES, David Sepiashvili introduced ...
Hey there, fellow traders!After the success of my original indicator, I've been hard at work creatin...
Understanding Kaufman's Adaptive Moving AveragePerry Kaufman introduced the Adaptive Moving Average ...
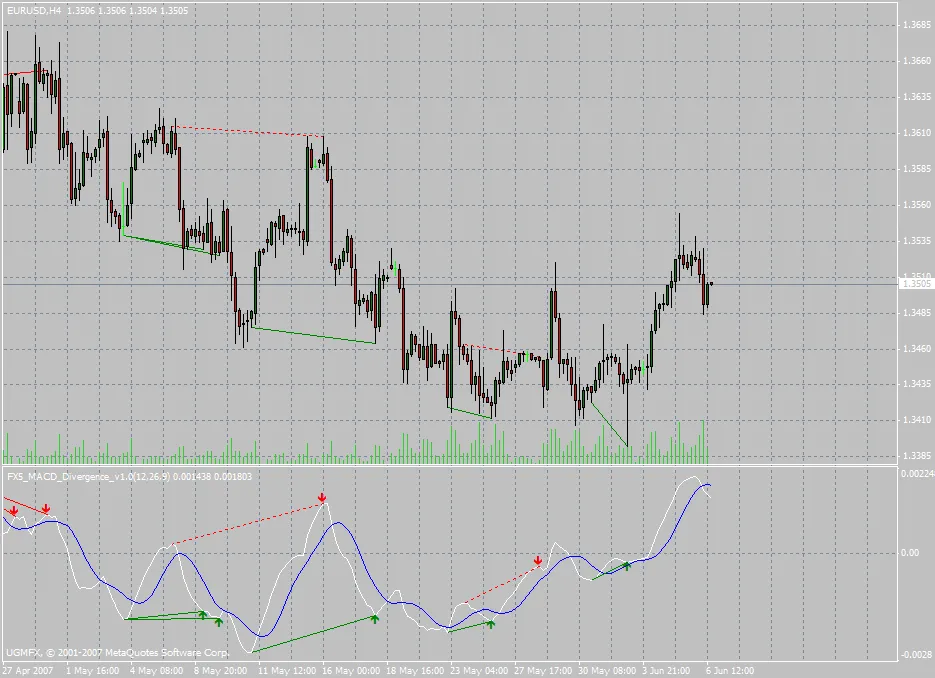
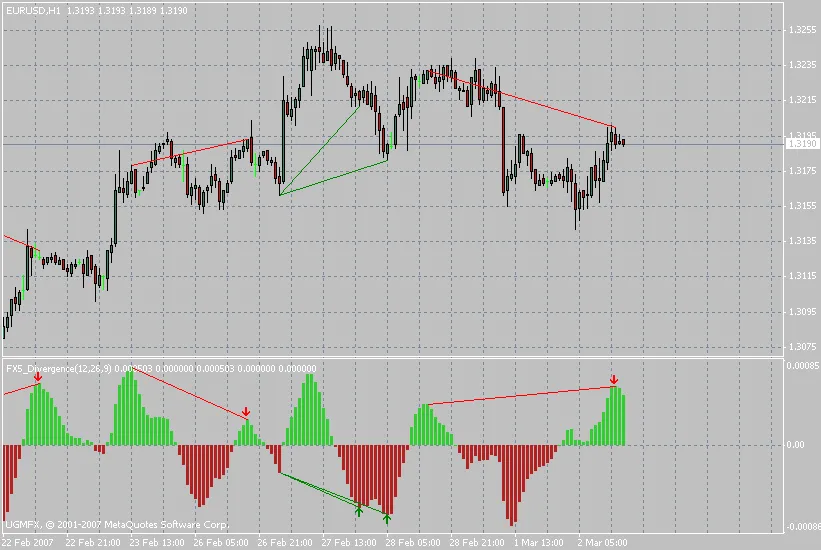
Divergence is a powerful strategy for identifying potential price reversals at key support and resis...
In the fast-paced world of trading, having the right tools at your disposal can make all the dif...
The i-OneThird indicator breaks down the difference between the high and low of a candle into three ...
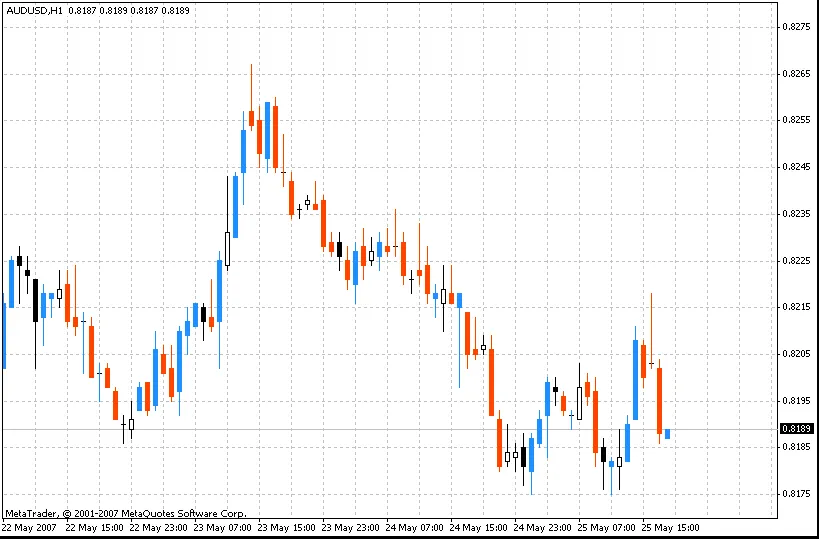
Hey traders! Today, let's dive into the i-HighLow indicator, a fantastic tool that helps you visuali...
This nifty indicator is a game-changer for traders who love to manage their open positions effective...
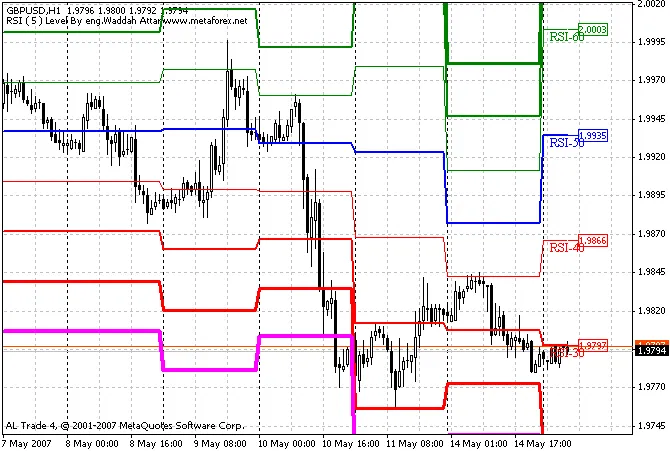
If you haven’t come across the Waddah Attar RSI Levels indicator yet, you’re in for a treat! This un...
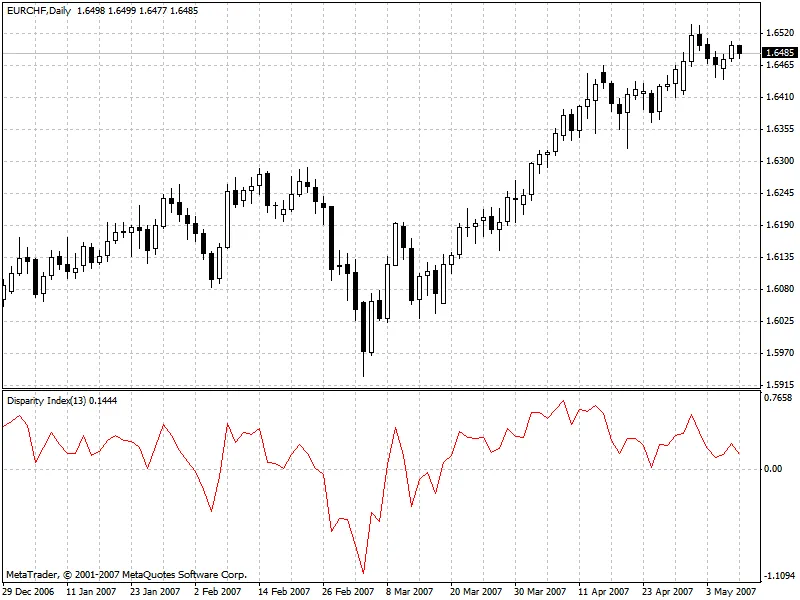
What is the Disparity Index? As traders, we’re always on the lookout for tools that can give us an e...
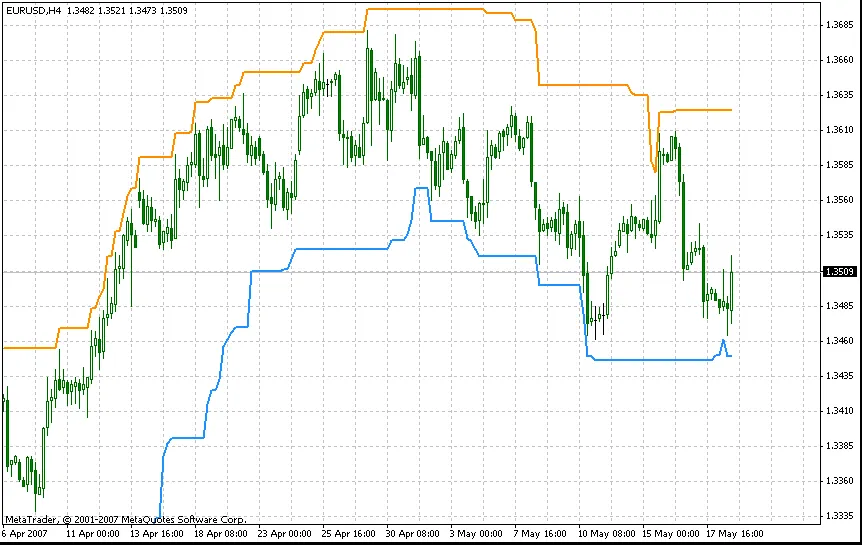
Hey fellow traders! Today, we're diving into the fascinating world of Stoller Average Range Channels...
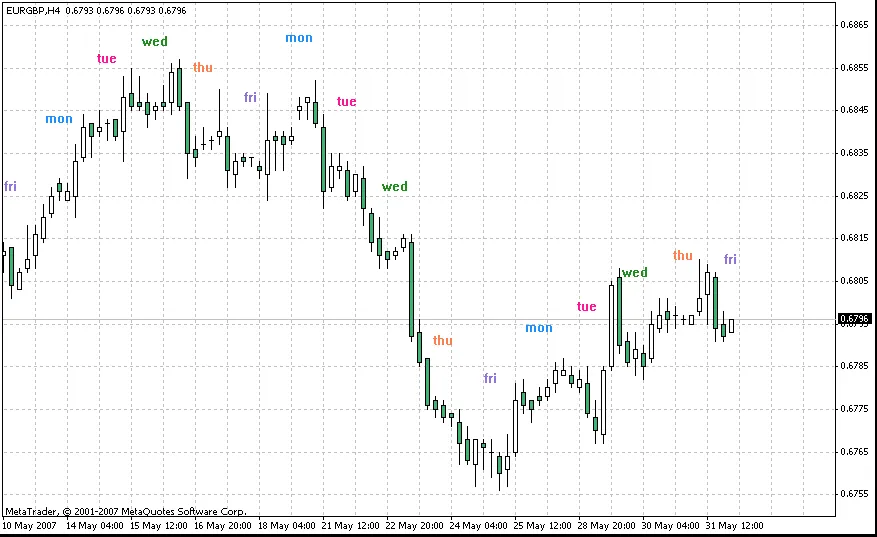
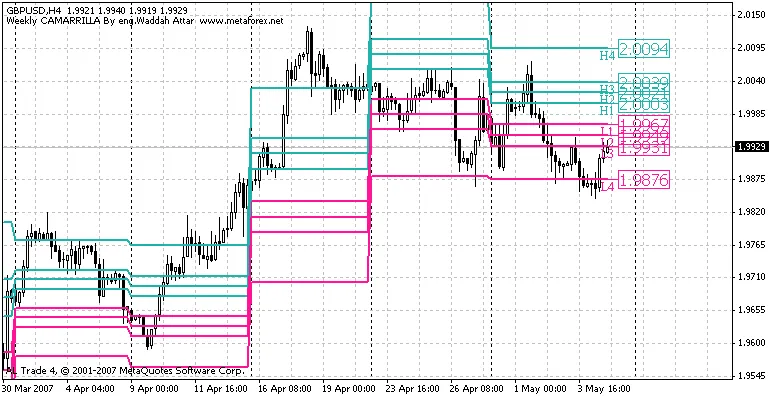
If you're a trader looking to enhance your weekly strategy, the Waddah Attar Indicator is a game-cha...
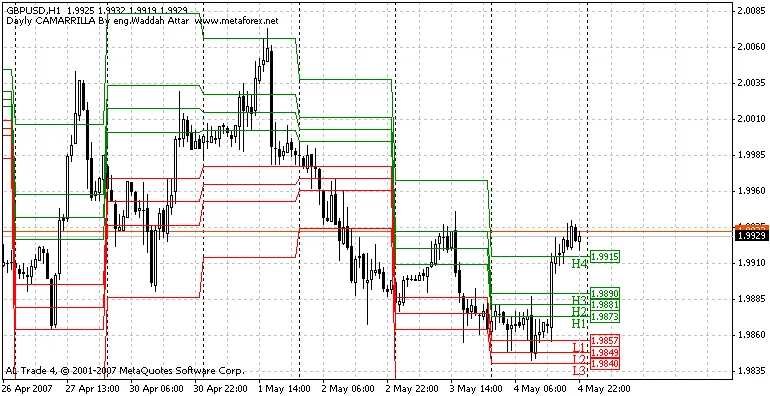
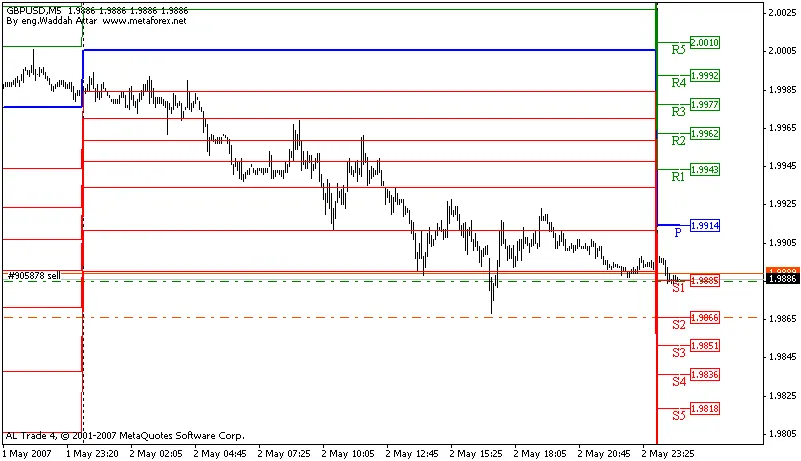
If you're looking to up your trading game, the Waddah Attar Daily CAMERILLA Indicator might just be ...
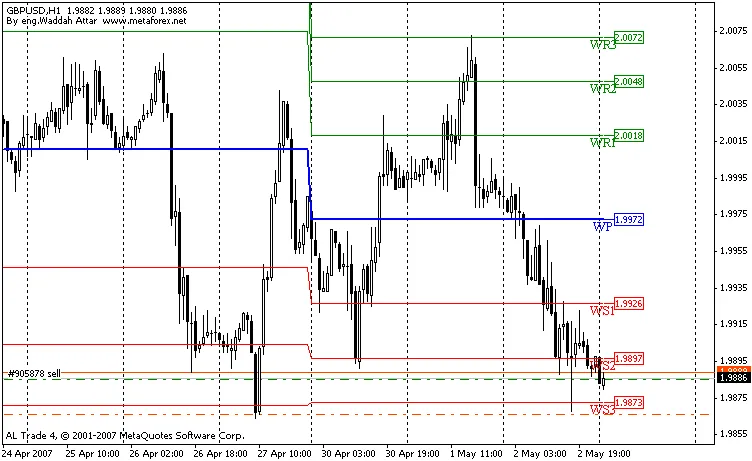
This indicator is a game changer for traders looking to pinpoint key market levels. The Waddah Attar...
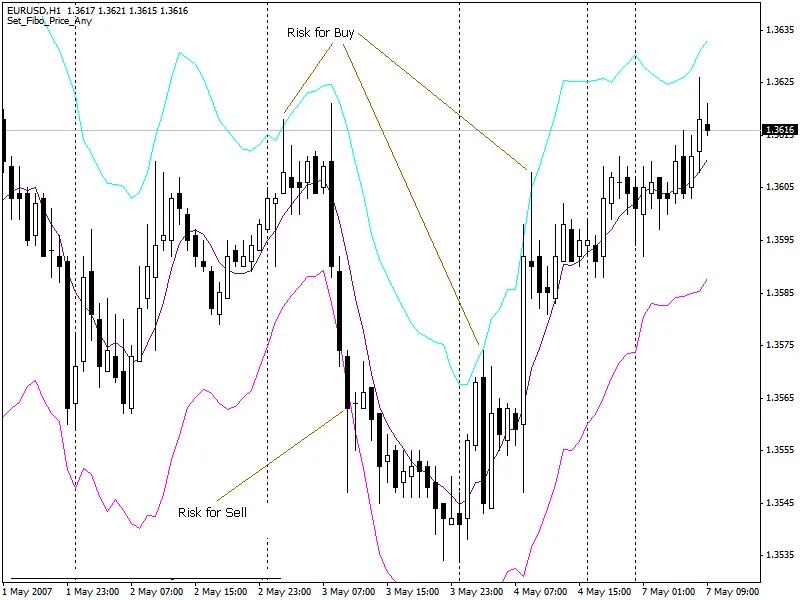
The Waddah Attar Pivot Fibo Daily Indicator is a powerful tool for traders looking to enhance their ...